You can create a genogram in Microsoft Word by adding shapes for family members, labeling them, and manually drawing relationship lines. That works for simple family maps, but it gets slow once you need standardized symbols, multi-generation edits, or detailed emotional and medical relationships. This guide shows the basic Word workflow, its main limitations, and when a dedicated genogram tool is easier to manage.
How to Make a Genogram in Word
If you are wondering how to make a genogram in Word, the short answer is yes, but only with manual setup. Word can handle a basic genogram, yet it does not include built-in genogram symbols, smart relationship mapping, or an easy way to keep large family diagrams aligned.
Word is usually enough when you need:
- A quick classroom assignment
- A simple family structure with only a few people
- A one-time printable document
You will probably need a dedicated tool if you want:
- Standard genogram symbols
- Faster editing across multiple generations
- Collaboration or sharing with others
- Medical, emotional, or case-management details in one view
If you still want to build one in Word, here is the most practical way to start.
Step 1: Open a Blank Document
Launch Microsoft Word and open a new blank document. It’s best to start with a clean slate for layout flexibility.
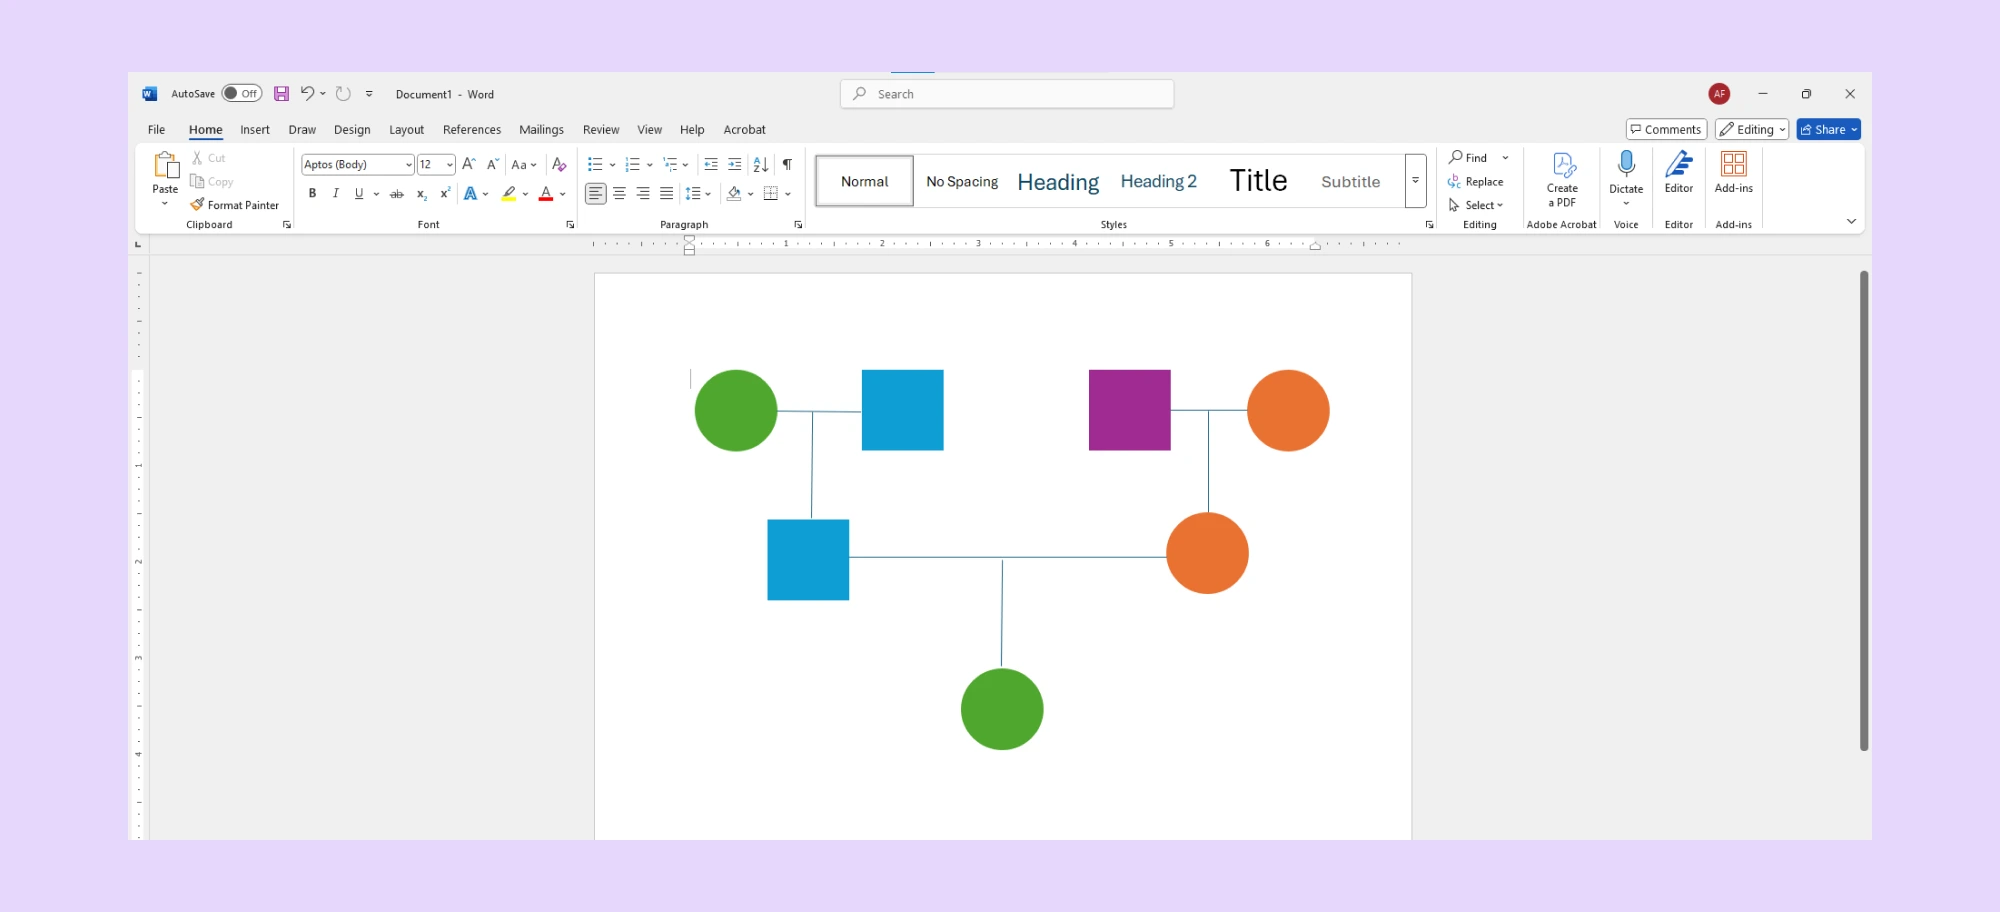
Step 2: Use SmartArt or Basic Shapes
Go to the Insert tab and choose SmartArt or basic shapes (like circles and squares) to represent family members. SmartArt can help with simple hierarchies, but it’s limited when it comes to complex relationship structures.
Step 3: Add Text Boxes for Names and Details
For each family member, insert a text box to label names, birthdates, or other relevant information. You’ll need to resize and manually align each element.
Step 4: Manually Draw Relationship Lines
Use lines or arrows to show relationships—marriages, siblings, parent-child connections, etc. Unfortunately, Word doesn’t automatically align or snap these lines, so expect a bit of trial and error.
Step 5: Use External Symbol Guides
Word doesn’t have genogram symbols, so you have to make them yourself using shapes. This might work for small families, but it’s hard and slow for bigger or more detailed genograms. Using a dedicated genogram maker can save hours—and your sanity.
Major Limitations of Making a Genogram in Word
Microsoft Word is useful for writing and basic visual layouts, so it can work for a small, one-time genogram. The limitations become more noticeable when the genogram needs standard symbols, frequent updates, multiple generations, emotional relationships, medical details, or team review.
Lack of Clinically Encoded Symbols
Standardized genograms require specific shapes to denote gender, health status, and life events (e.g., McGoldrick/Gerson standards). Word lacks a dedicated library, forcing you to manually group basic shapes. This leads to inconsistencies that can result in clinical misinterpretation during a case review.
Static Lines vs. Functional Relationships
In Word, a line is just a line. It doesn’t “know” the difference between a biological parent and a conflictual emotional bond. Modern standards require encoded relationship types—such as hostile, fused, or estranged—which move dynamically with the map. In Word, moving one “family member” requires you to manually reconnect every associated line.
Zero Pattern Recognition or “Lenses”
A genogram’s true value lies in identifying hereditary patterns (like heart disease or substance abuse) across generations. Word treats the genogram as a static visual, so it cannot filter or highlight patterns across the family map. You are forced to perform the analysis manually, increasing the risk of overlooking critical red flags or recurring family themes.
Manual Setup Takes Time
Building even a basic genogram from scratch using intake notes can take hours of tedious formatting. Because everything is done by hand—from drawing lines to resizing shapes—it’s easy to make mistakes.
Compliance and Data Security Risks
Genograms contain highly sensitive Protected Health Information (PHI). Word documents are often saved locally or sent via unencrypted email, posing significant security risks. Without HIPAA-certified storage, role-based access, and a secure audit trail, maintaining professional and legal confidentiality standards is nearly impossible.
For anyone looking to build a detailed, accurate, and collaborative genogram, Word simply isn’t designed for the job. That’s where tools like Creately come in—with built-in genogram templates, symbols, and smart features to make the entire process faster and easier.
When to Use Creately Instead of Word
Word can be enough for a simple genogram, but it becomes harder to manage as the diagram grows. If you need standard genogram symbols, relationship types, structured details, collaboration, or export-ready documentation, Creately can give you a more practical workspace.
Ready-to-Use Genogram Templates
No need to start from scratch. Choose from a range of genogram templates—whether you’re building a family genogram, a medical genogram, or mapping out emotional relationships. Templates are professionally designed and fully customizable.
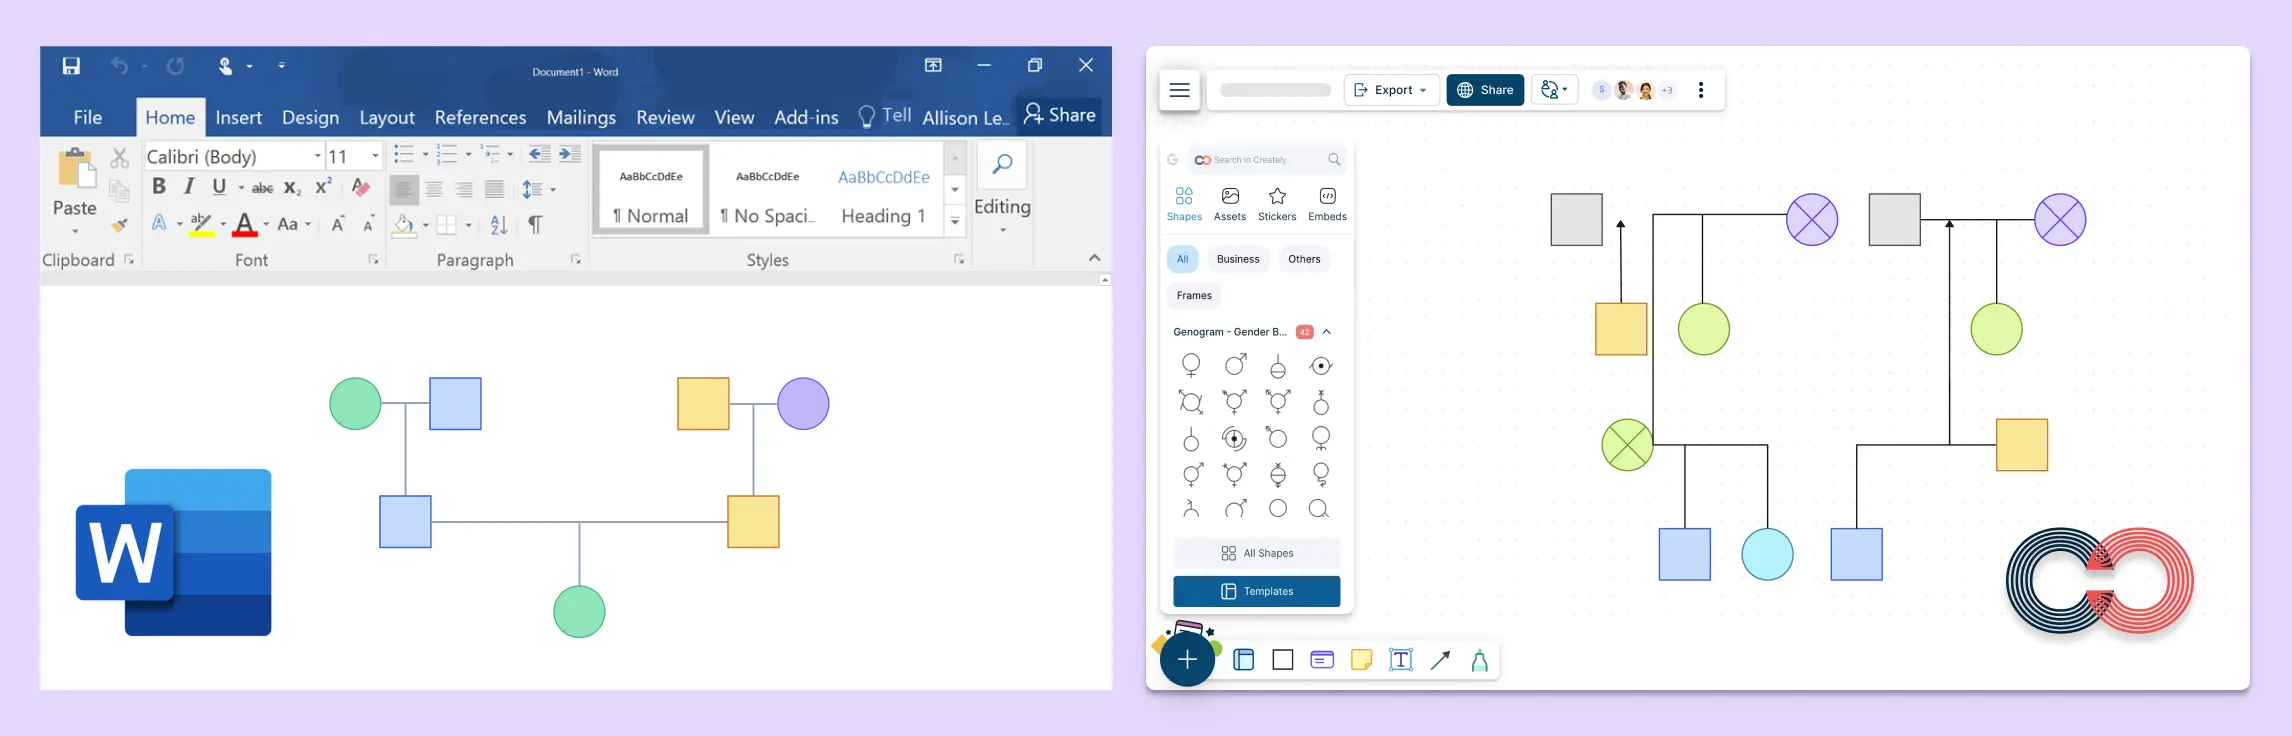
Standardized McGoldrick/Gerson Notation
Creately provides an extensive library of over 40 auto-derived person shapes and 71 clinically encoded relationship types. Unlike Word’s basic shapes, these are built to strict McGoldrick/Gerson standards, ensuring your diagrams are professionally accurate and universally understood by other practitioners.
Intelligent Relationship Mapping
Forget manual line-drawing. Creately’s smart connectors recognize the logic of family structures. Whether you are mapping biological links or complex emotional dynamics (such as “fused,” “estranged,” or “hostile”), the lines snap into place and maintain their logical connections even as you move family members around.
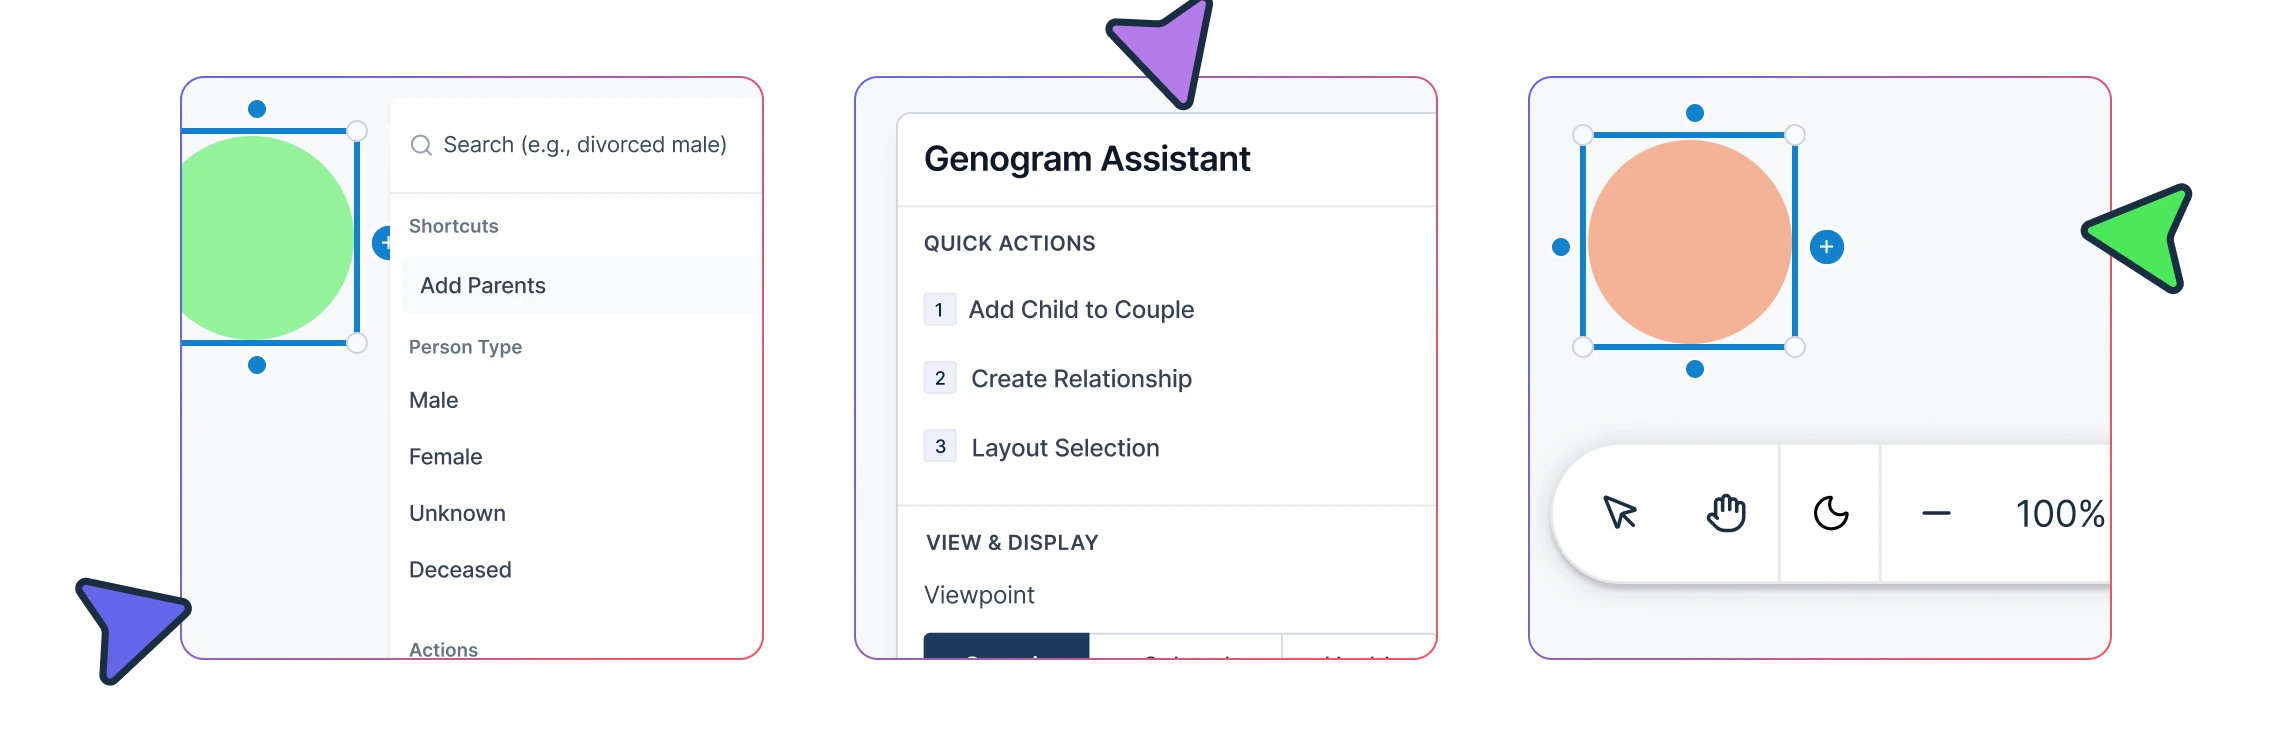
High-Speed Drafting with Keyboard Shortcuts
In a live session, speed is critical. Creately allows you to build out three-generation structures at the speed of conversation using easy keyboard shortcuts. This eliminates the “double-handling” of notes and lets you focus entirely on the client.
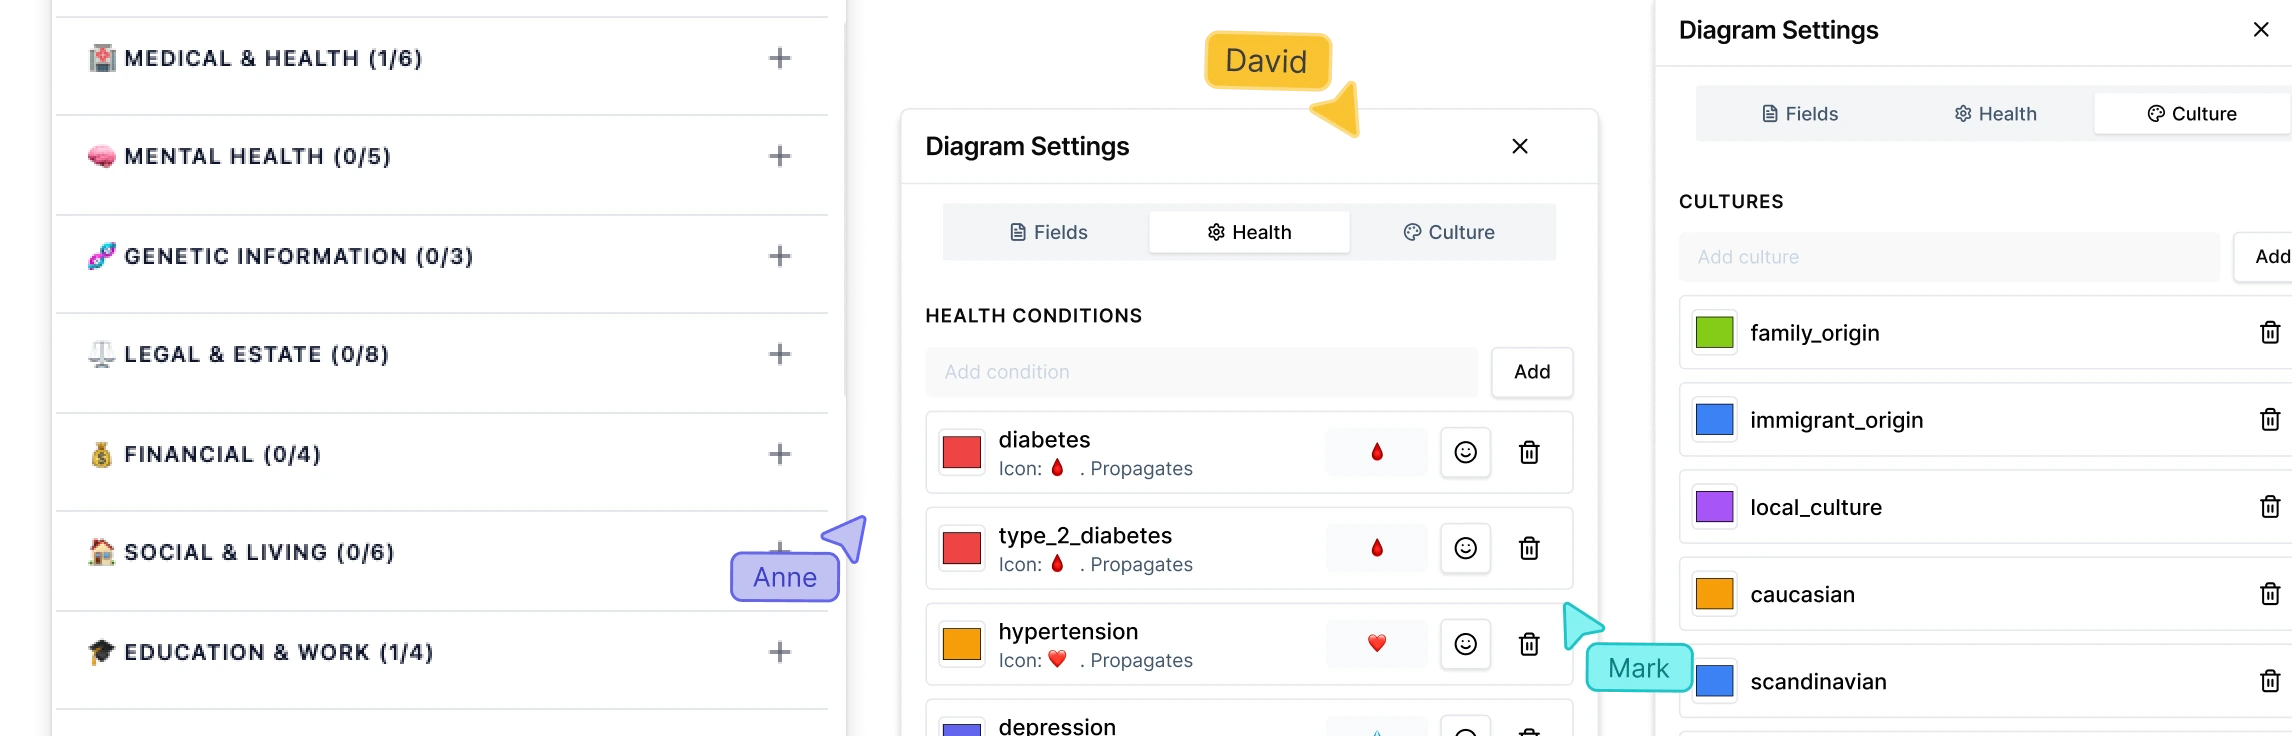
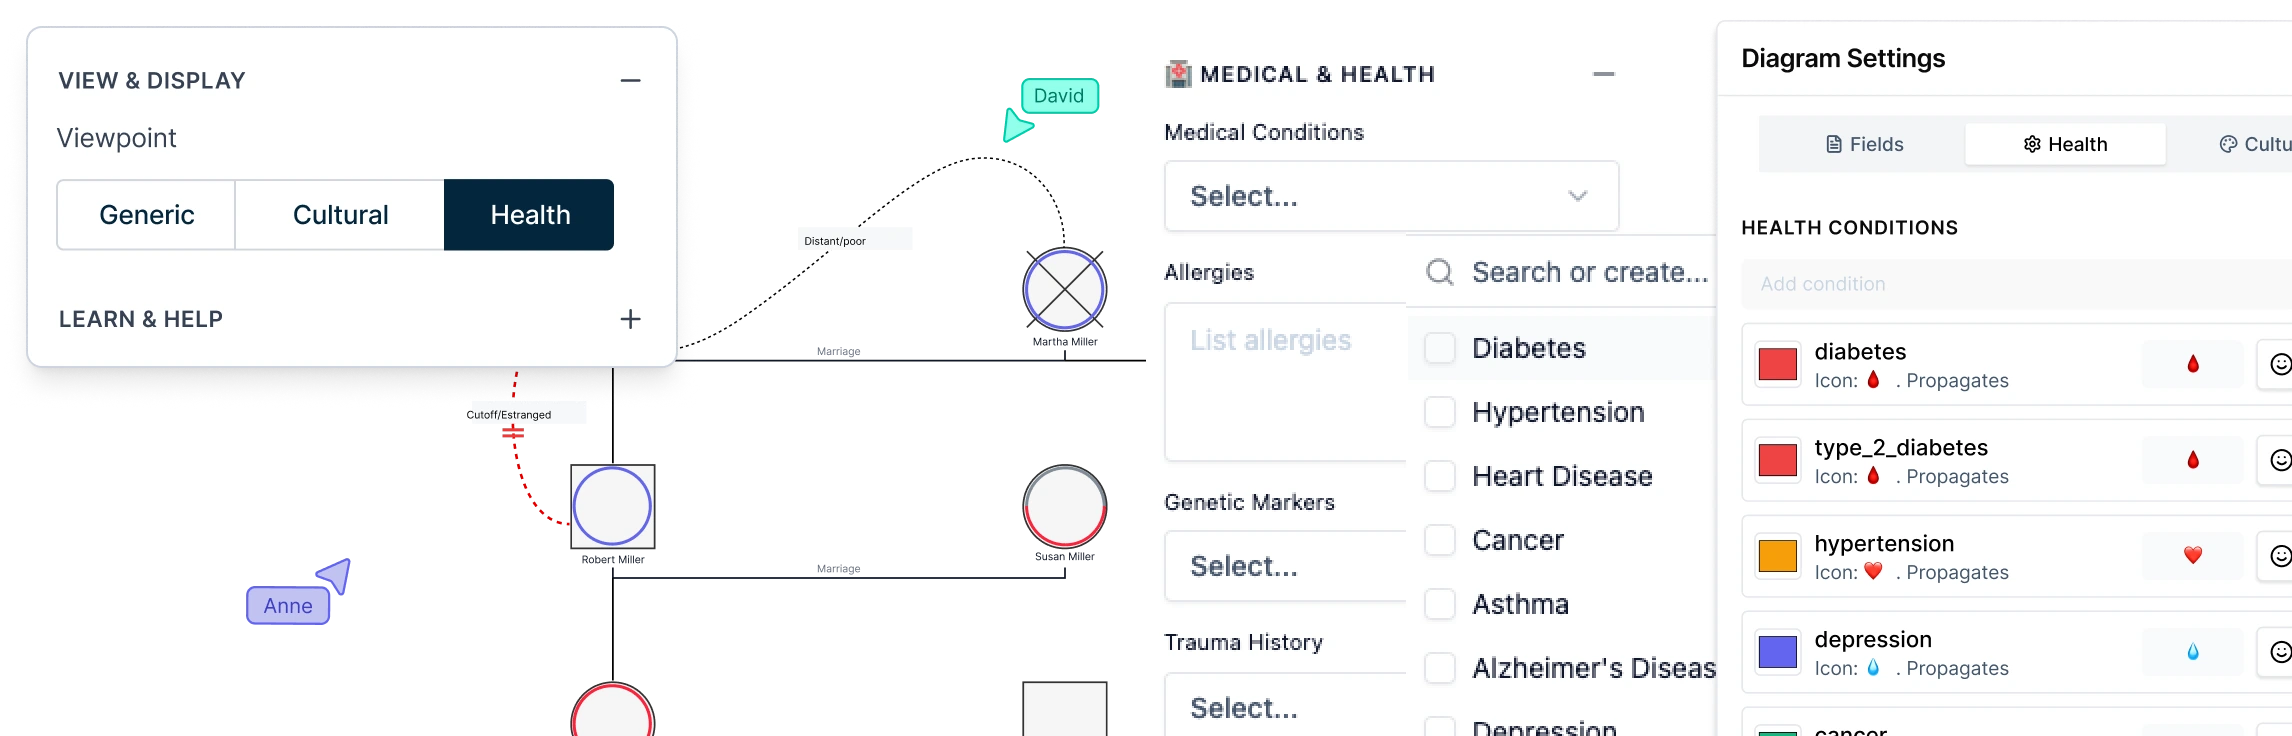
Multi-Dimensional Data Lenses
Go beyond a flat image. Creately allows you to layer specific “Field Packs” onto your map. You can toggle between different “Lenses” (like a Health View or Emotional View) to instantly highlight hereditary risks or recurring relationship patterns without cluttering the primary diagram.
HIPAA-Compliant Collaboration
Genograms contain sensitive Protected Health Information (PHI). Creately offers a secure, HIPAA-compliant environment for real-time collaboration. Teams in healthcare or social work can co-edit maps, leave clinical comments, and manage role-based permissions, ensuring that sensitive data remains protected and centralized.
Real-Time Collaboration and Sharing
Working in social work, therapy, or healthcare? Collaborate with your team or clients in real time. Creately supports multi-user editing, comments, and easy sharing—no version chaos, no delays.
Export and Documentation Options
Creately lets you export genograms as PDF, PNG, SVG, or share them with a link. For professional workflows, you can also create report-ready outputs that include the diagram and supporting context, instead of rebuilding the same information in a separate document.
How to Make a Genogram With Creately
Step 1: Start With a Template or AI Draft
Choose a genogram template, start from a blank canvas, or use Creately’s AI genogram generator to create a first draft from a written family description or notes.
Step 2: Review and Refine the AI Draft
If you generate the genogram with AI, review the structure before moving forward. Check names, relationships, generations, and missing details so the diagram reflects the information accurately.
Step 3: Add Family Members
Use genogram symbols, quick-add tools, and shortcuts to add people such as partners, children, parents, and siblings.
Step 4: Connect Relationships
Add relationship lines for marriages, separations, divorces, adoptive relationships, foster relationships, blended families, or emotional dynamics.
Step 5: Add Context
Add names, dates, notes, health details, emotional patterns, attachments, or case information where relevant.
Step 6: Use AI to Review Patterns or Gaps
Use AI-assisted support to help review the genogram for patterns, missing information, or areas that may need closer attention. Always check the suggestions against your own notes or source information before finalizing.
Step 7: Review and Share
Clean up the layout, invite others to review or comment, then export the genogram as PDF, PNG, SVG, or share it with a link.
Genogram Examples Made with Creately
One of the biggest advantages of using Creately is the ability to start with professionally designed templates for different use cases. Whether you’re mapping out a family history or analyzing emotional patterns, Creately offers a variety of visual, easy-to-edit genogram examples.
Here are a few popular ones:
Family Genogram Examples


Medical Genogram Examples


Emotional Relationship Genogram Examples


These genogram templates are all editable and easy to customize—just drag, drop, and adjust as needed. Whether you’re working on a clinical case, school project, or personal exploration, Creately gives you a head start with visual clarity and accuracy.
Helpful Resources
Discover everything you need to know about genograms, from what they are, how to create a genogram, to how to understand what they mean.
Explore our collection of genogram templates.
Learn how different types of genograms can help visualize important aspects of life.
Explore the essential symbols used in genograms to represent everything from basic family structures to complex emotional and medical relationships.
FAQs on How to Create a Genogram in Word
What are the challenges of creating a genogram in Word?
Is there a better alternative to creating a genogram in Word?
Can I use Word for a professional genogram?
What are the limitations of using Word for genograms?
No genogram symbols or templates
Manual formatting is slow
Hard to align or edit complex layouts
Not made for emotional or medical mapping
How do I save or share my genogram in Word?
Resources:
Alexander, J.H., Callaghan, J.E.M. and Fellin, L.C. (2018). Genograms in research: participants’ reflections of the genogram process. Qualitative Research in Psychology, 19(1), pp.1-21. doi:https://doi.org/10.1080/14780887.2018.1545066.
Butler, J.F. (2008). The Family Diagram and Genogram: Comparisons and Contrasts. The American Journal of Family Therapy, 36(3), pp.169-180. doi:https://doi.org/10.1080/01926180701291055.
Puhlman, D., Shigeto, A., MurilloBorjas, G.A., Maurya, R.K. and Vincenti, V.B. (2023). Qualitative genogram analysis: A methodology for theorizing family dynamics. Journal of Family Theory & Review, 15(2), pp.276-291. doi:https://doi.org/10.1111/jftr.12496.