In social work practice, a genogram helps practitioners move beyond a basic family tree and see the patterns surrounding a client’s life more clearly. It can bring family structure, caregiving roles, conflict, trauma, mental health history, and support systems into one visual assessment tool.
This guide explains what a genogram is in social work, why it matters in practice, which symbols are commonly used, and how social workers can turn that information into better-informed interventions.
What Is a Genogram in Social Work?
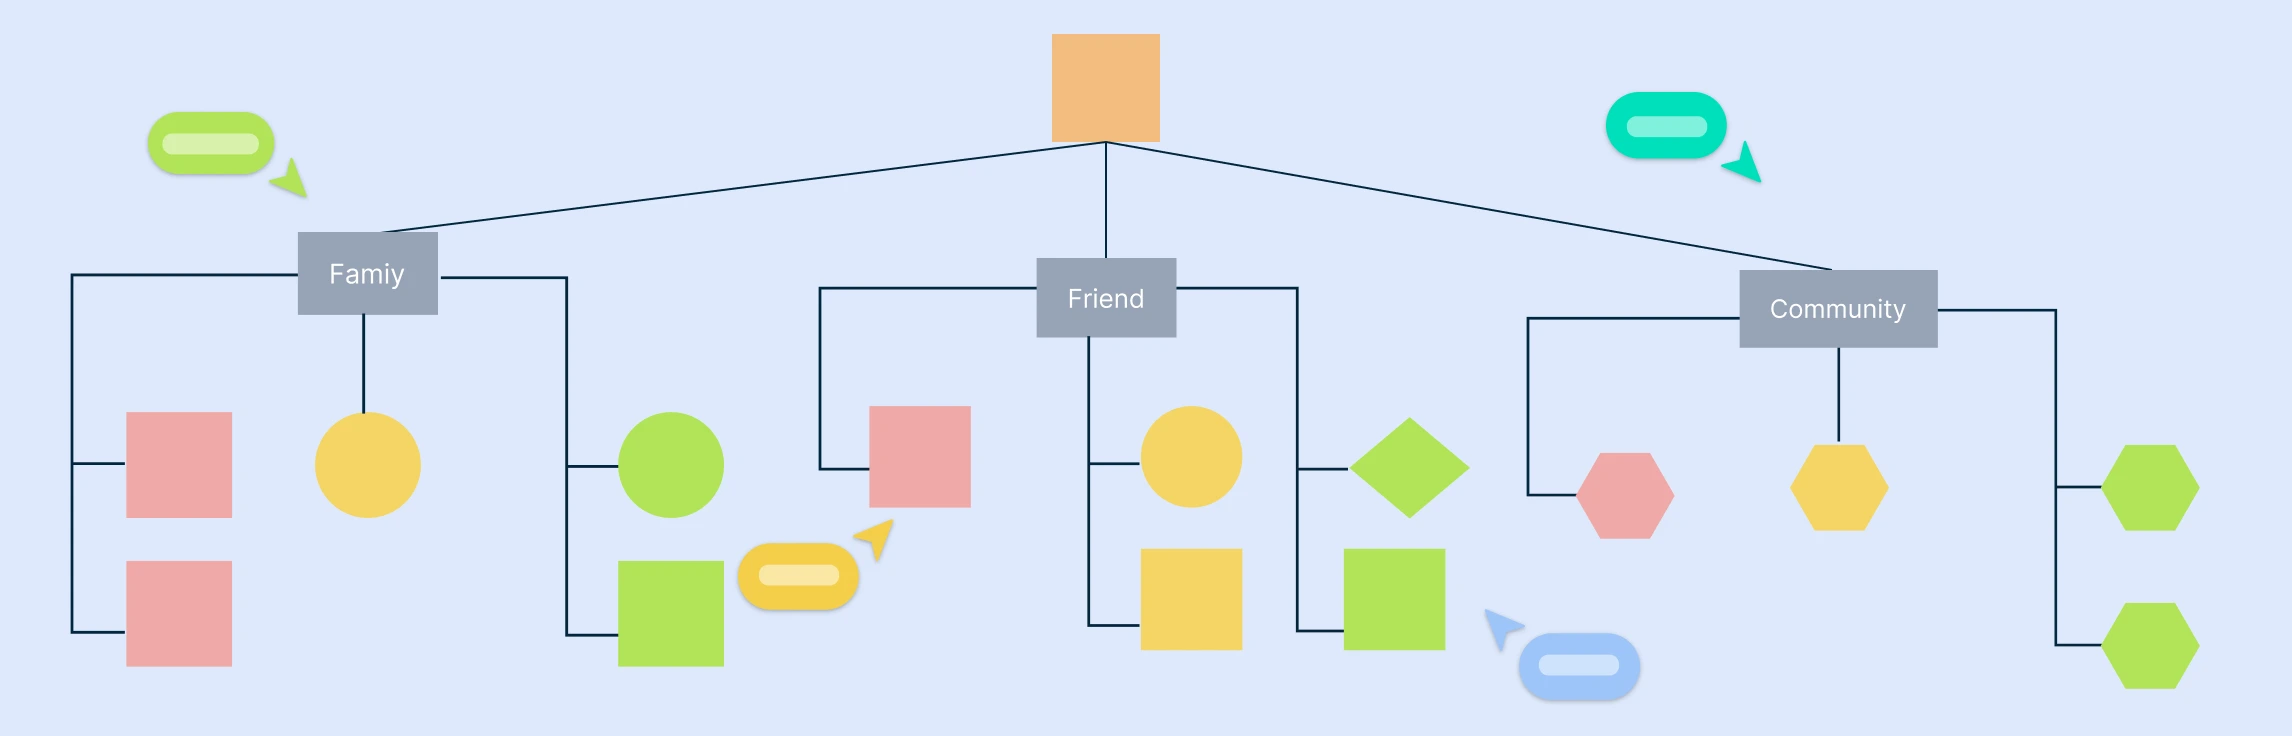
A genogram in social work is a visual assessment tool that maps family relationships, emotional connections, and important patterns across generations. It helps social workers organize information about household structure, caregiving, trauma, health concerns, conflict, and resilience in a format that is easier to discuss and review.
Why Genograms Matter in Social Work Practice
- Understanding Family History: genograms help social workers explore relationships, past experiences, and cultural influences that may be shaping a client’s current situation.
- Identifying Patterns and Dynamics: They make recurring issues such as addiction, abuse, estrangement, mental health concerns, or caregiving strain easier to spot.
- Strengthening Intervention Planning: A visual map helps practitioners design supports that fit the family’s actual structure, risks, and strengths.
- Improving Client Engagement: When clients can see the system being discussed, difficult conversations often become easier and more collaborative.
- Supporting Reflection and Empathy: Genograms help clients and practitioners notice how family history has shaped identity, coping strategies, and present-day stressors.


Social Work Genogram Symbols
Genograms in social work use a standardized visual language. The symbols below help practitioners represent family structure, relationship status, emotional dynamics, and health-related context clearly.
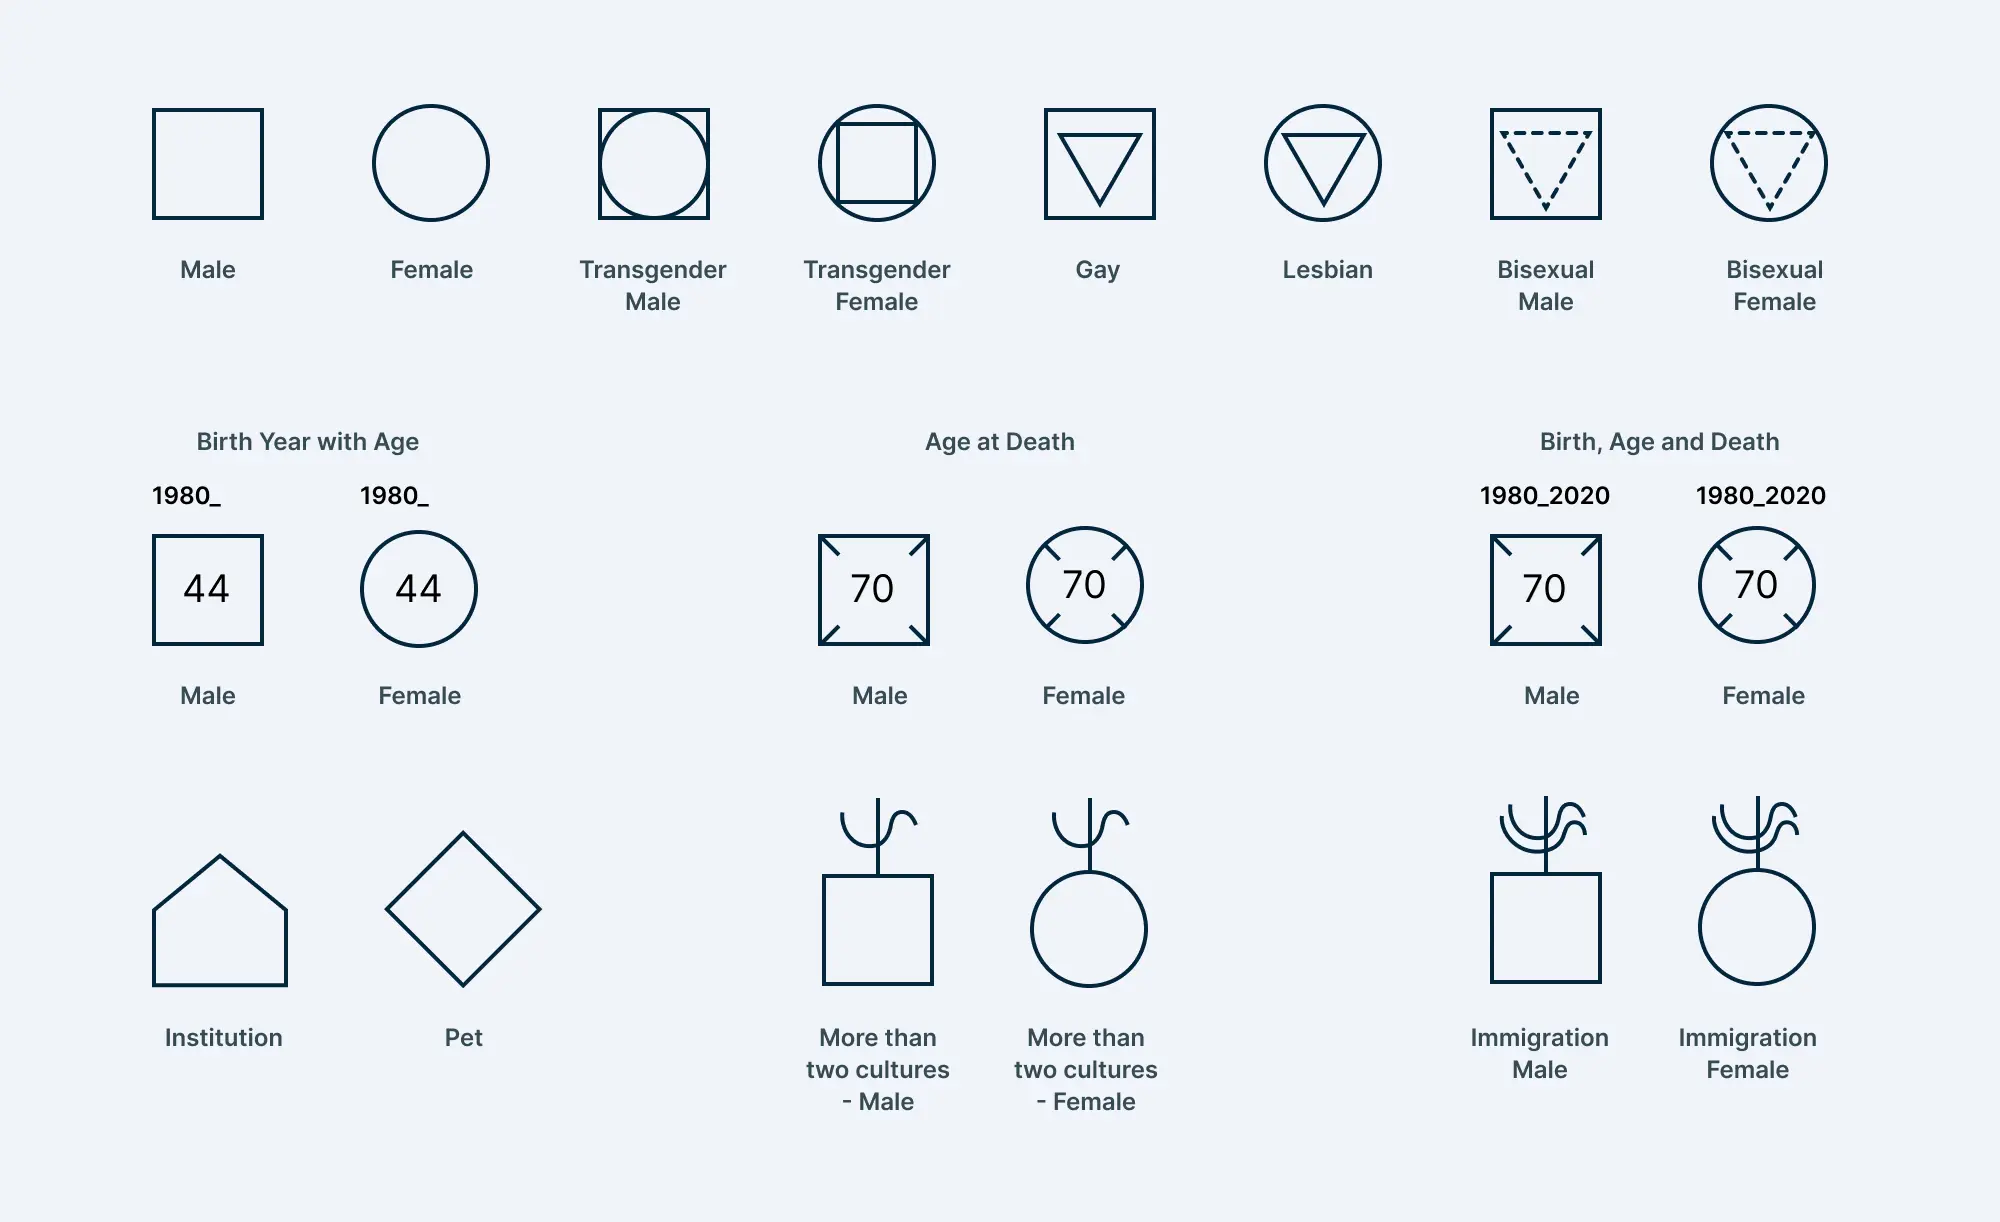
Basic Genogram Symbols
Males are represented by squares, and females by circles.
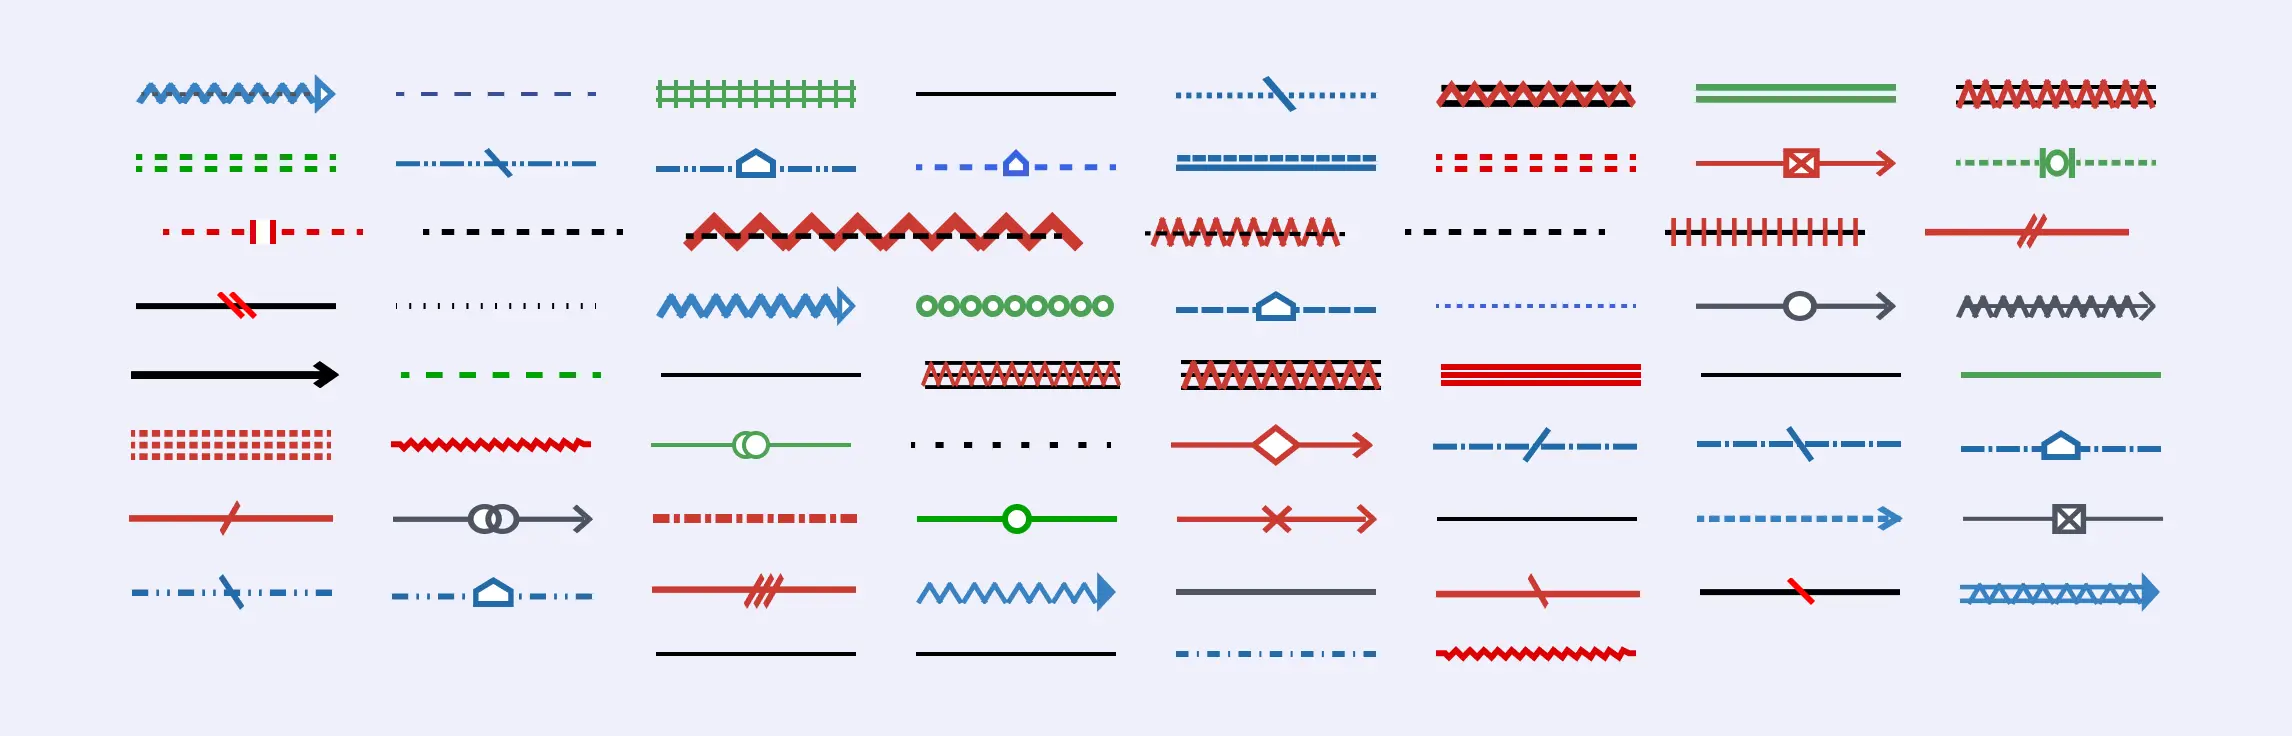
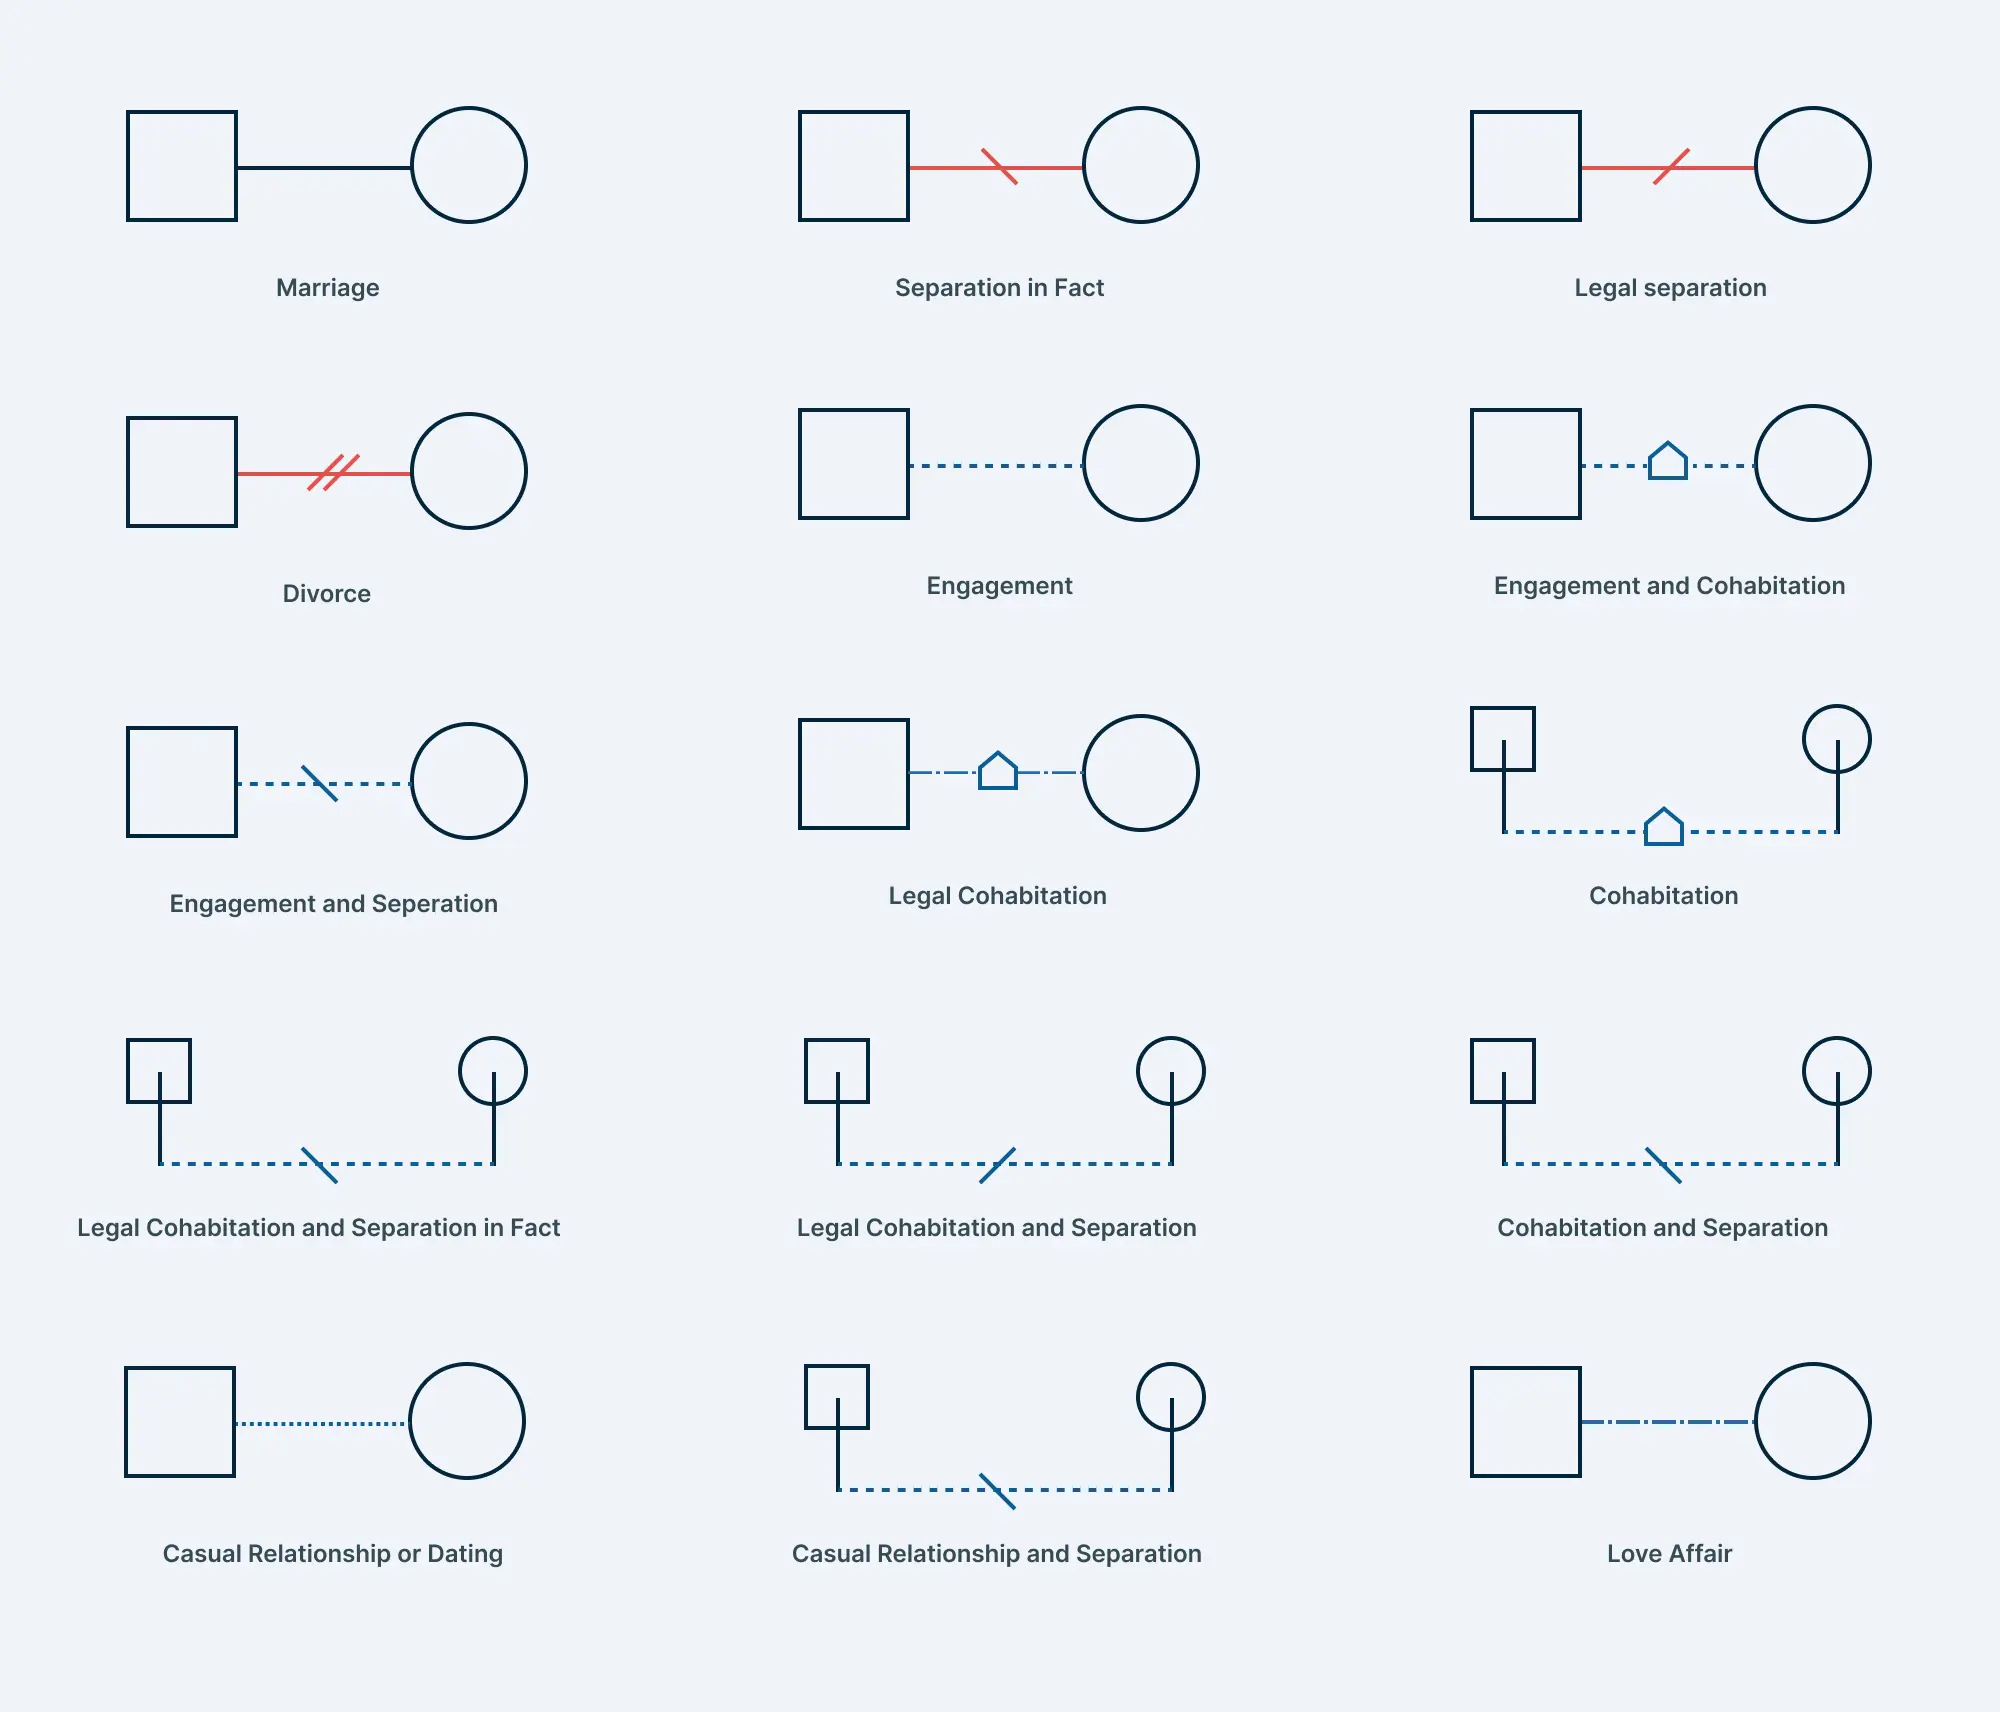
Marital Status Relationship Symbols
A solid line connects married couples, while a double slash through the line indicates divorce. Other types of relationships are also represented through genogram symbols.
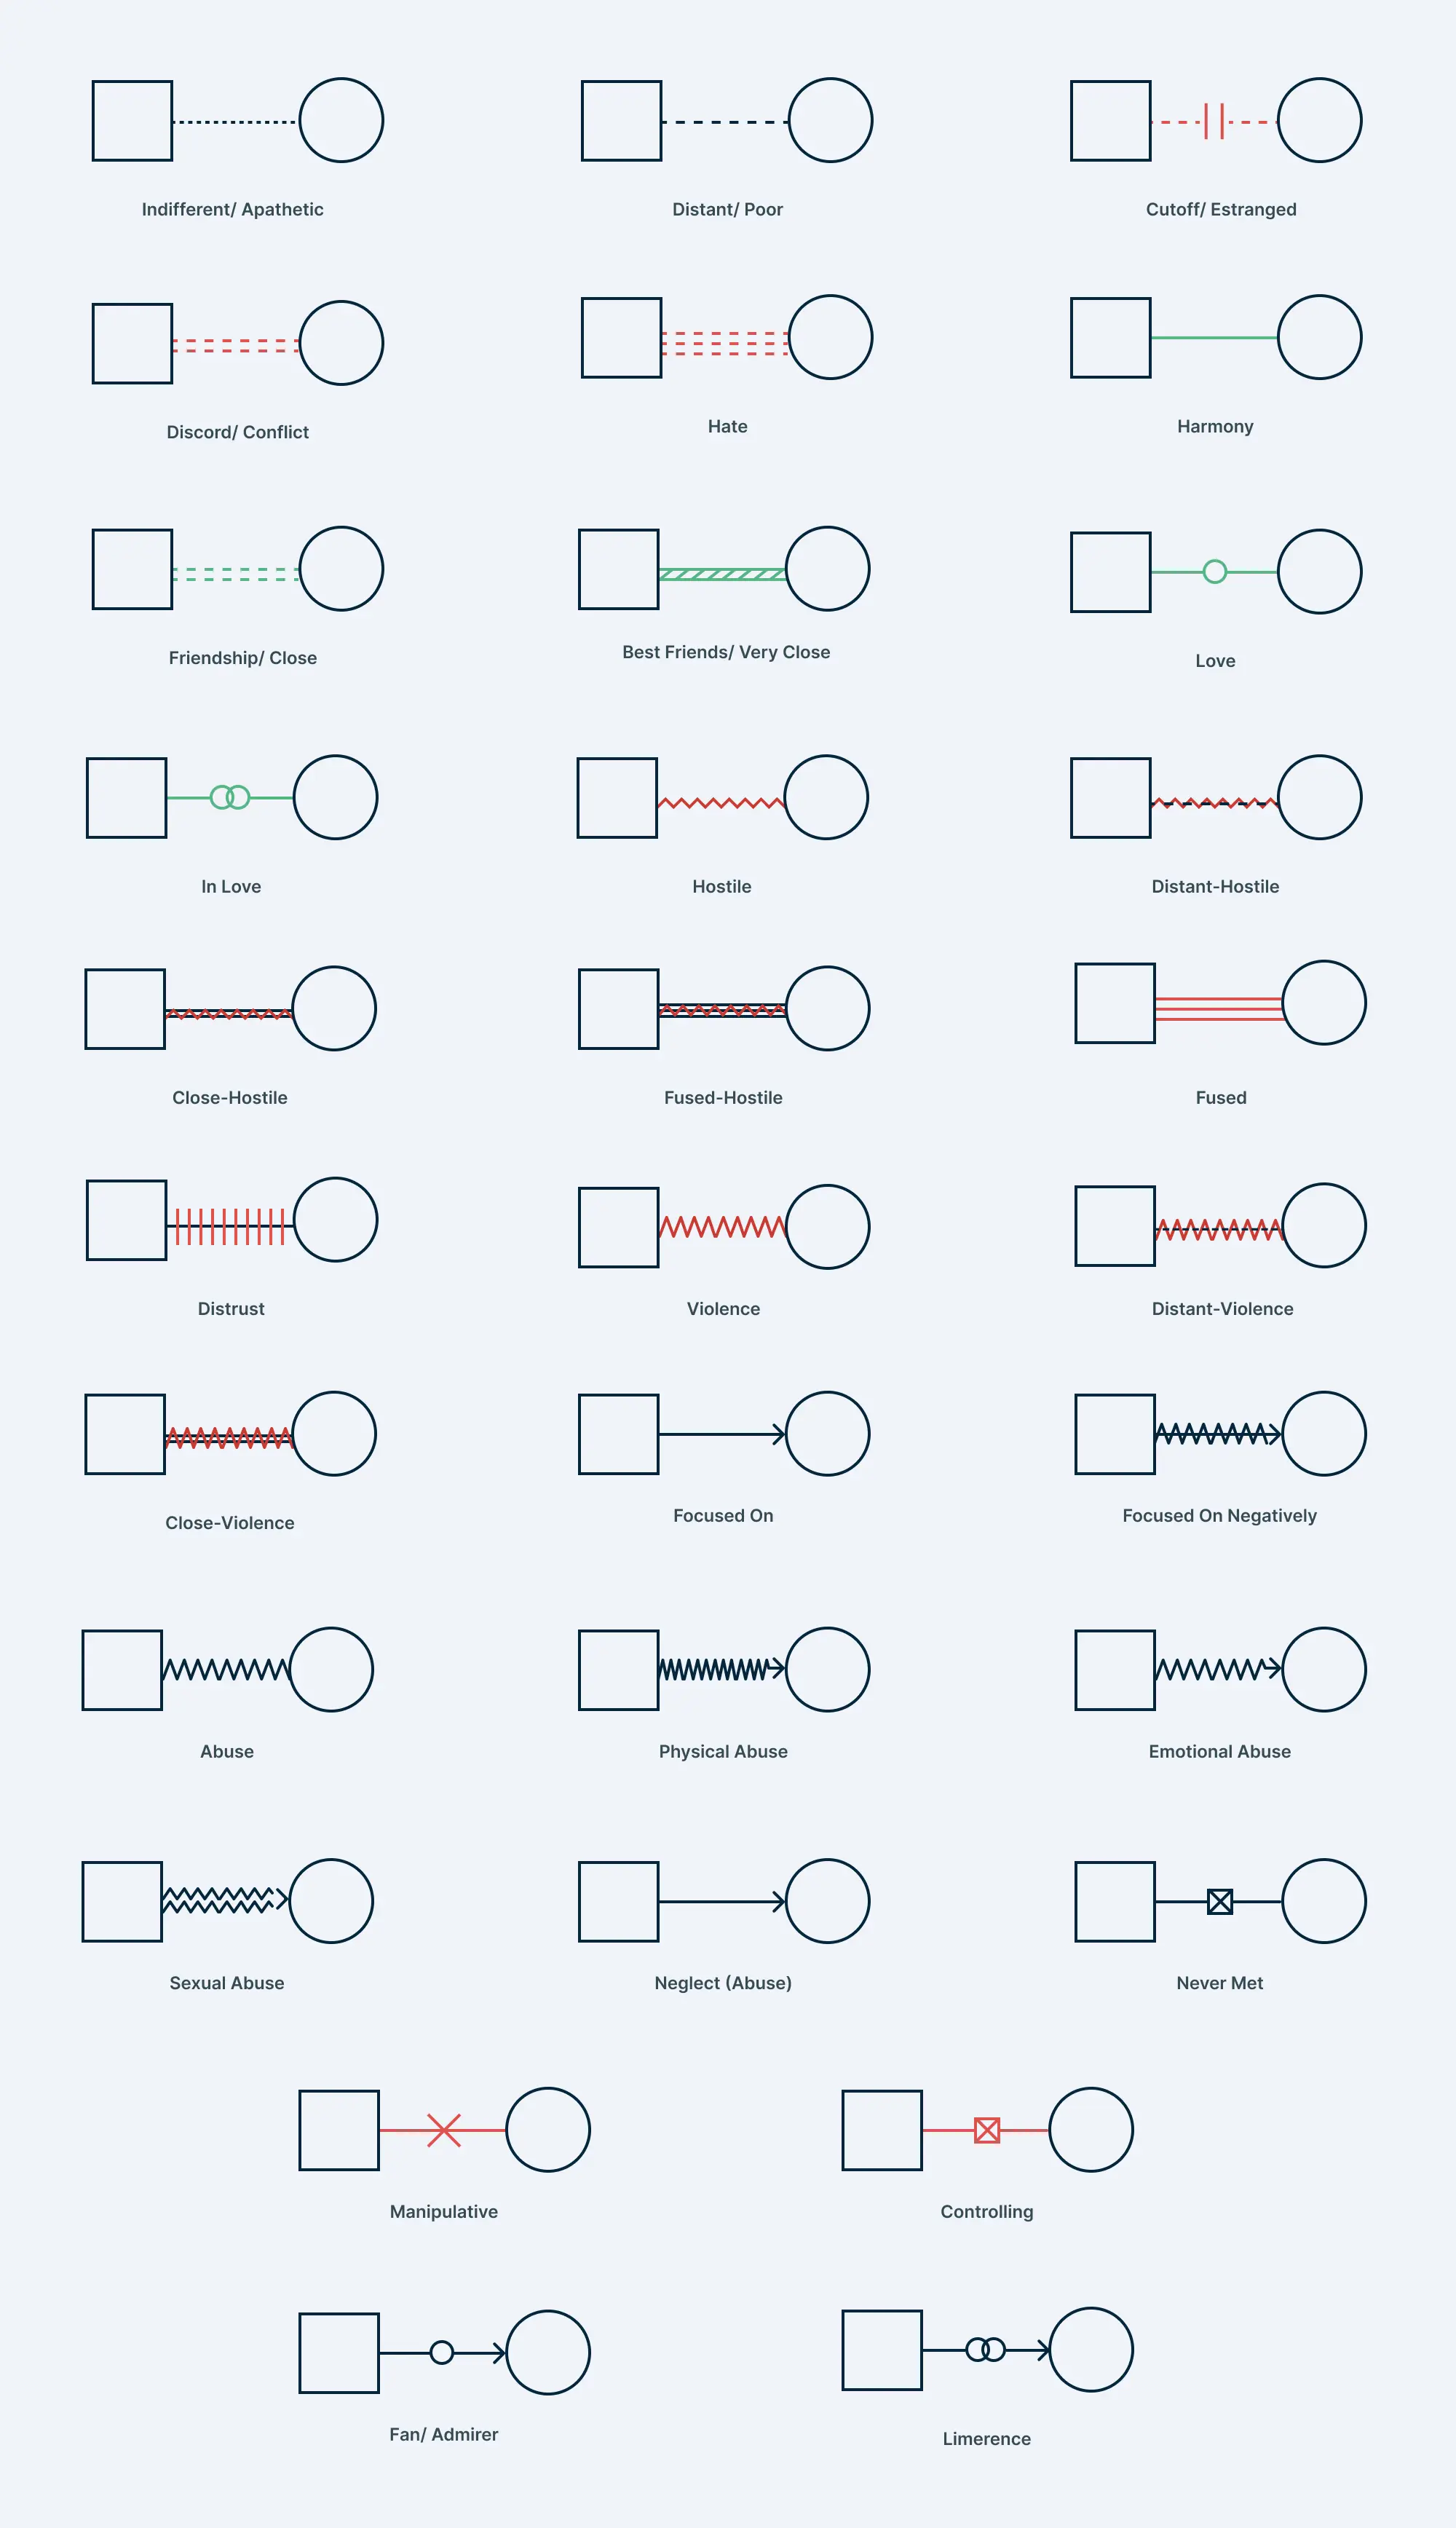
Emotional Relationship Symbols
Different types of emotional bonds (e.g., close, distant, conflictual) are represented using various dashed or wavy lines.
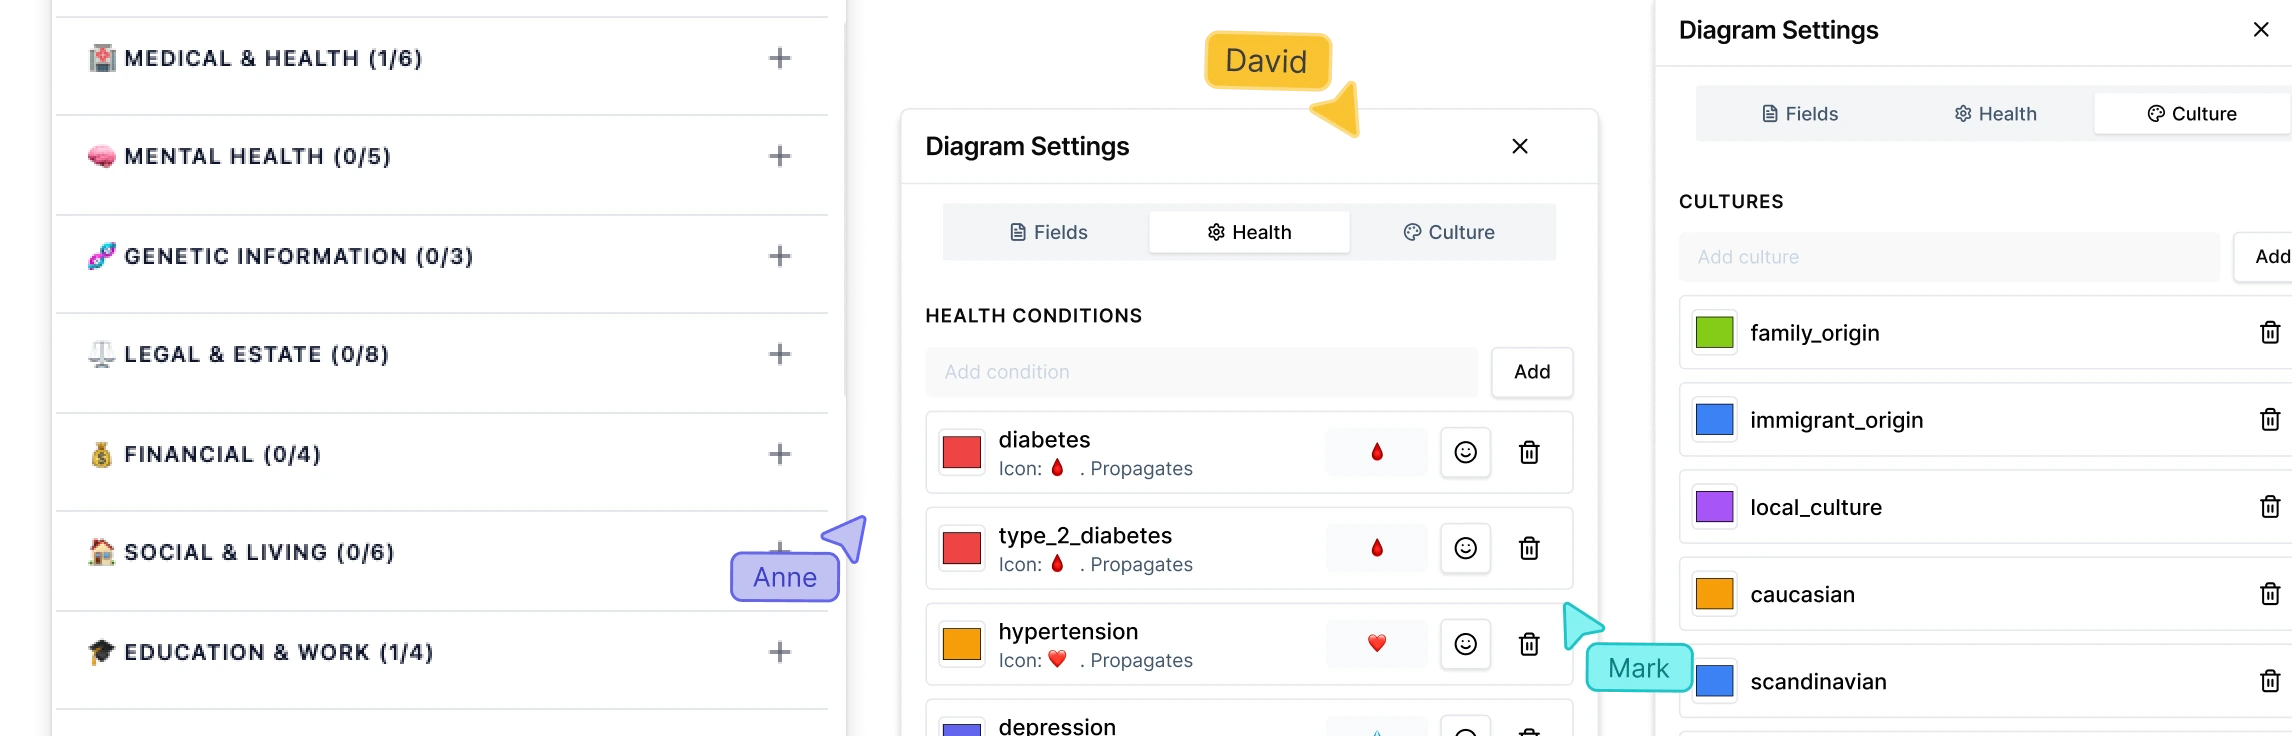
Genogram Symbols for Medical & Psychological Conditions
Symbols can indicate health issues like depression, addiction, or diseases.
Creately includes a large library of relationship and status symbols for genograms. To learn these symbols in more detail, read our guide on genogram symbols, which covers 70+ commonly used symbols.
How to Create a Social Work Genogram with Creately
Creating a genogram is a transformative process in social work, turning scattered family histories into a structured, clinical data map. By following these steps, you can move beyond simple “family trees” to identify deep-seated patterns of trauma, resilience, and hereditary risk.
Note: Approach the creation process with clinical sensitivity and accuracy. Always respect client confidentiality and ensure you have informed consent before documenting sensitive family information.
Step 01. Gather Family Information
Interview Clients and Family Members
To build an accurate genogram, start with open and empathetic interviews. Engage in conversations that explore at least three generations of family history. Use active listening to capture not just names and dates, but the “emotional vibe” of the household.
Collect Key Clinical Data
During the intake, collect standard data such as ages and genders, but look deeper. Inquire about:
- Legal & Biological Status: Adoptions, foster care arrangements, and finalized vs. pending divorces.
- Medical & Mental Health History: Document chronic illnesses, substance abuse patterns, and neurodivergence.
- Relational Dynamics: Identify emotional cutoffs, fused relationships, or high-conflict triangles.
Step 02. Build the Genogram in Real-Time
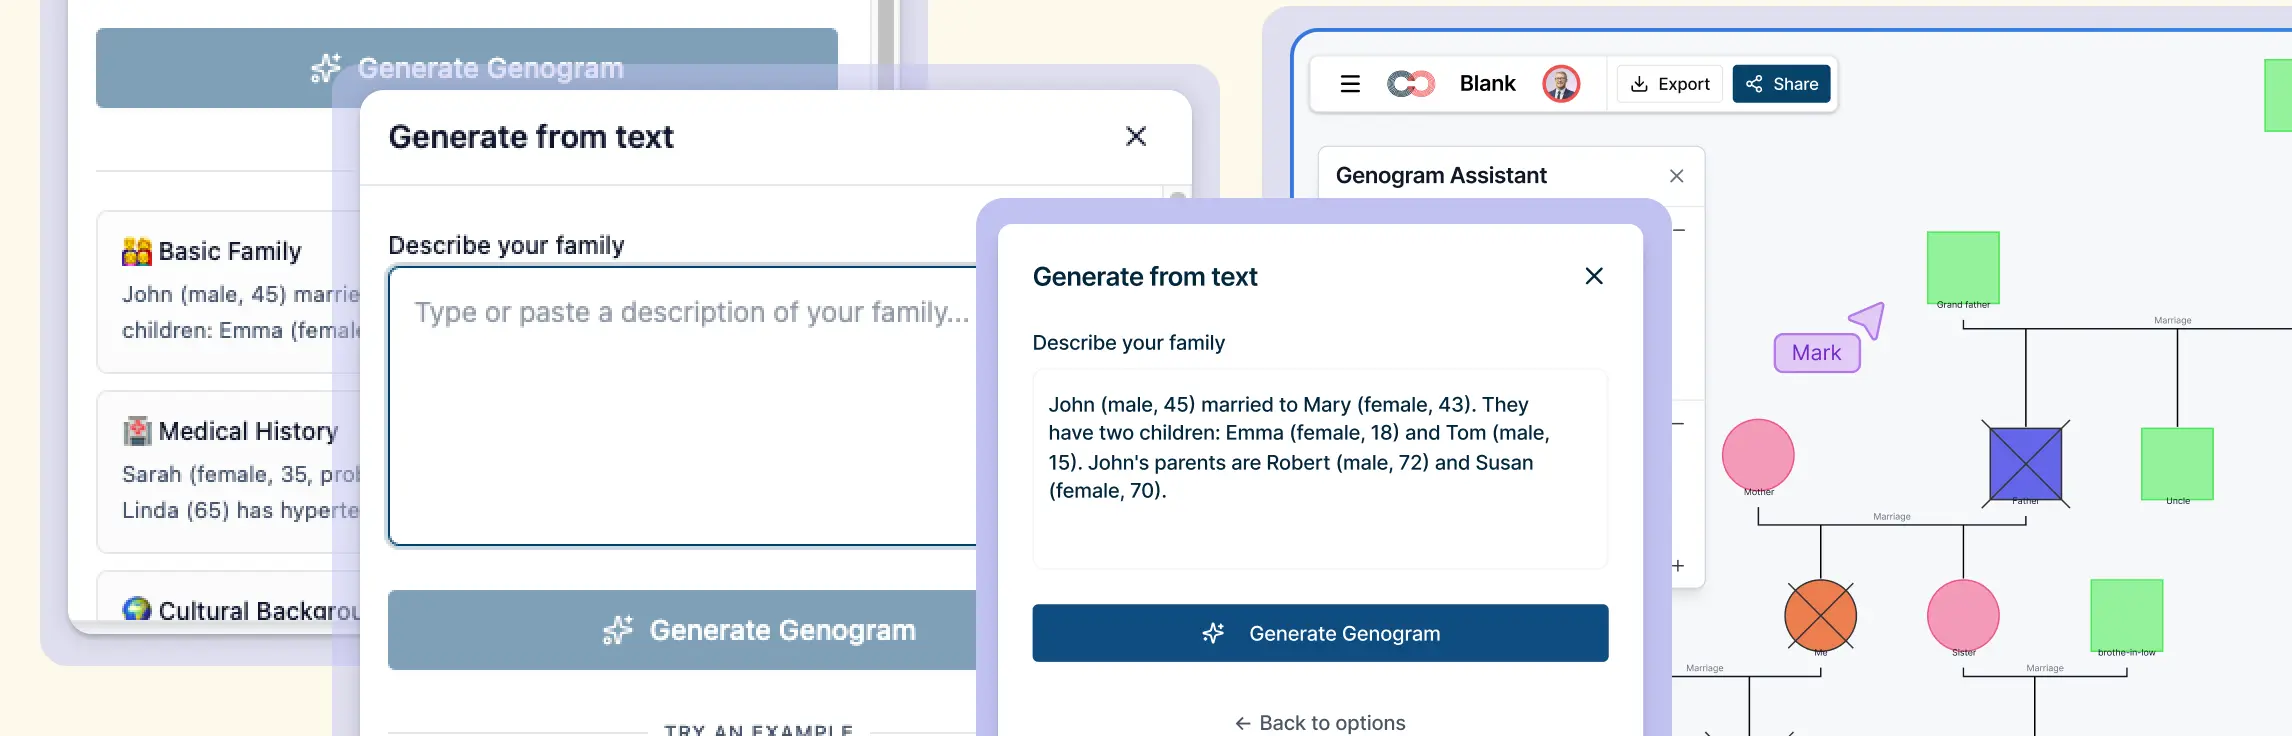
Use Text-to-Genogram for a Starting Draft
Instead of drafting everything manually after a session, you can use AI Text-to-Genogram in Creately to turn intake notes or interview transcripts into a starting family structure. This can save time when you need an initial draft that you can then review and refine.
Organize with Standardized Symbols
Once the foundation is set, use a standardized library of relationship and status types. Following McGoldrick/Gerson standards helps keep the diagram readable for other clinicians and consistent in documentation.
- Quick-Add Shortcuts: Use keyboard shortcuts to build out the tree more efficiently during conversation.
- Centralize Data: Use the Data Panel to attach files, sensitive notes, or trauma history directly to specific family nodes, keeping your case file organized.
Secure Collaboration
Social work often involves working with legal or medical teams. Share your genogram via secure, HIPAA-compliant links with role-based permissions (Viewer, Editor, or Moderator) to ensure sensitive data is only accessible to authorized stakeholders.
Step 03. Analyze through Layered Views
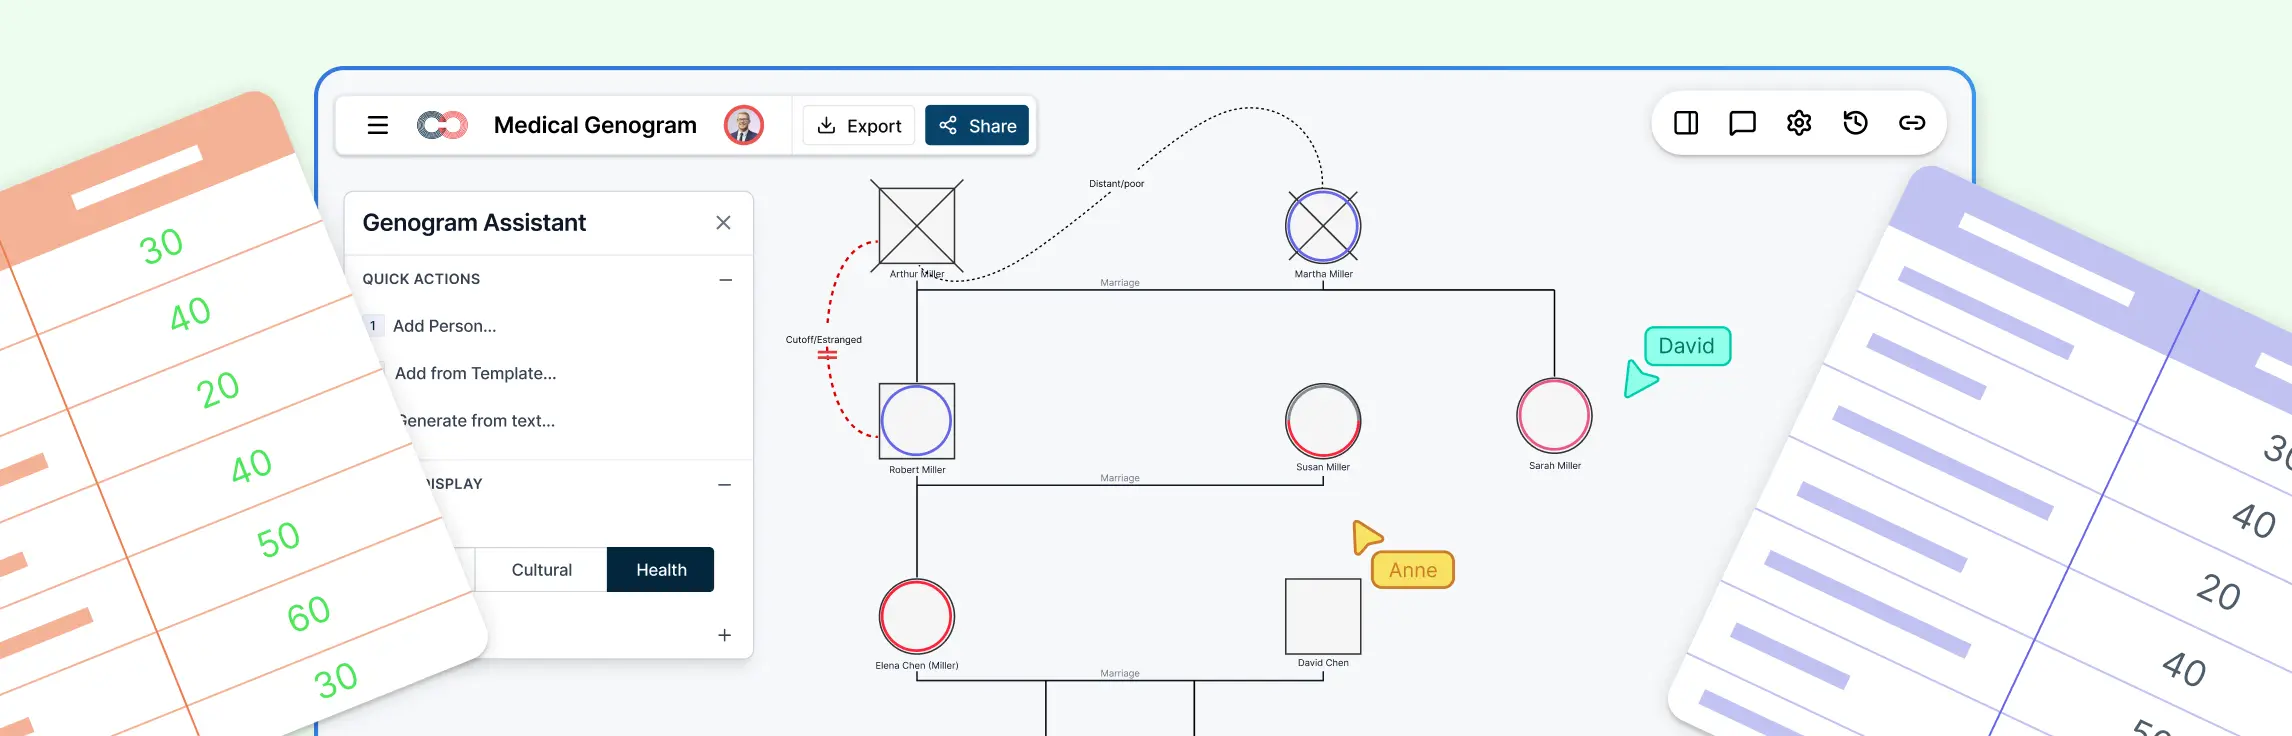
Toggle Clinical Lenses
A genogram can be reviewed from different angles depending on your current assessment goal. Use layered views to focus on the information that matters most:
- Generic View: This is your foundational layer. It provides a clean, high-level overview of the family structure, including names, ages, and basic connections. It is ideal for initial case presentations or when you need a clear “big picture” of the family tree without the clutter of detailed clinical data.
- Cultural View: Social work requires understanding the family within its broader environment. This view highlights cultural background, migration history, religious affiliations, and significant community influences. It helps clinicians identify cultural strengths, potential conflicts with societal norms, and the impact of the family’s heritage on their current dynamics.
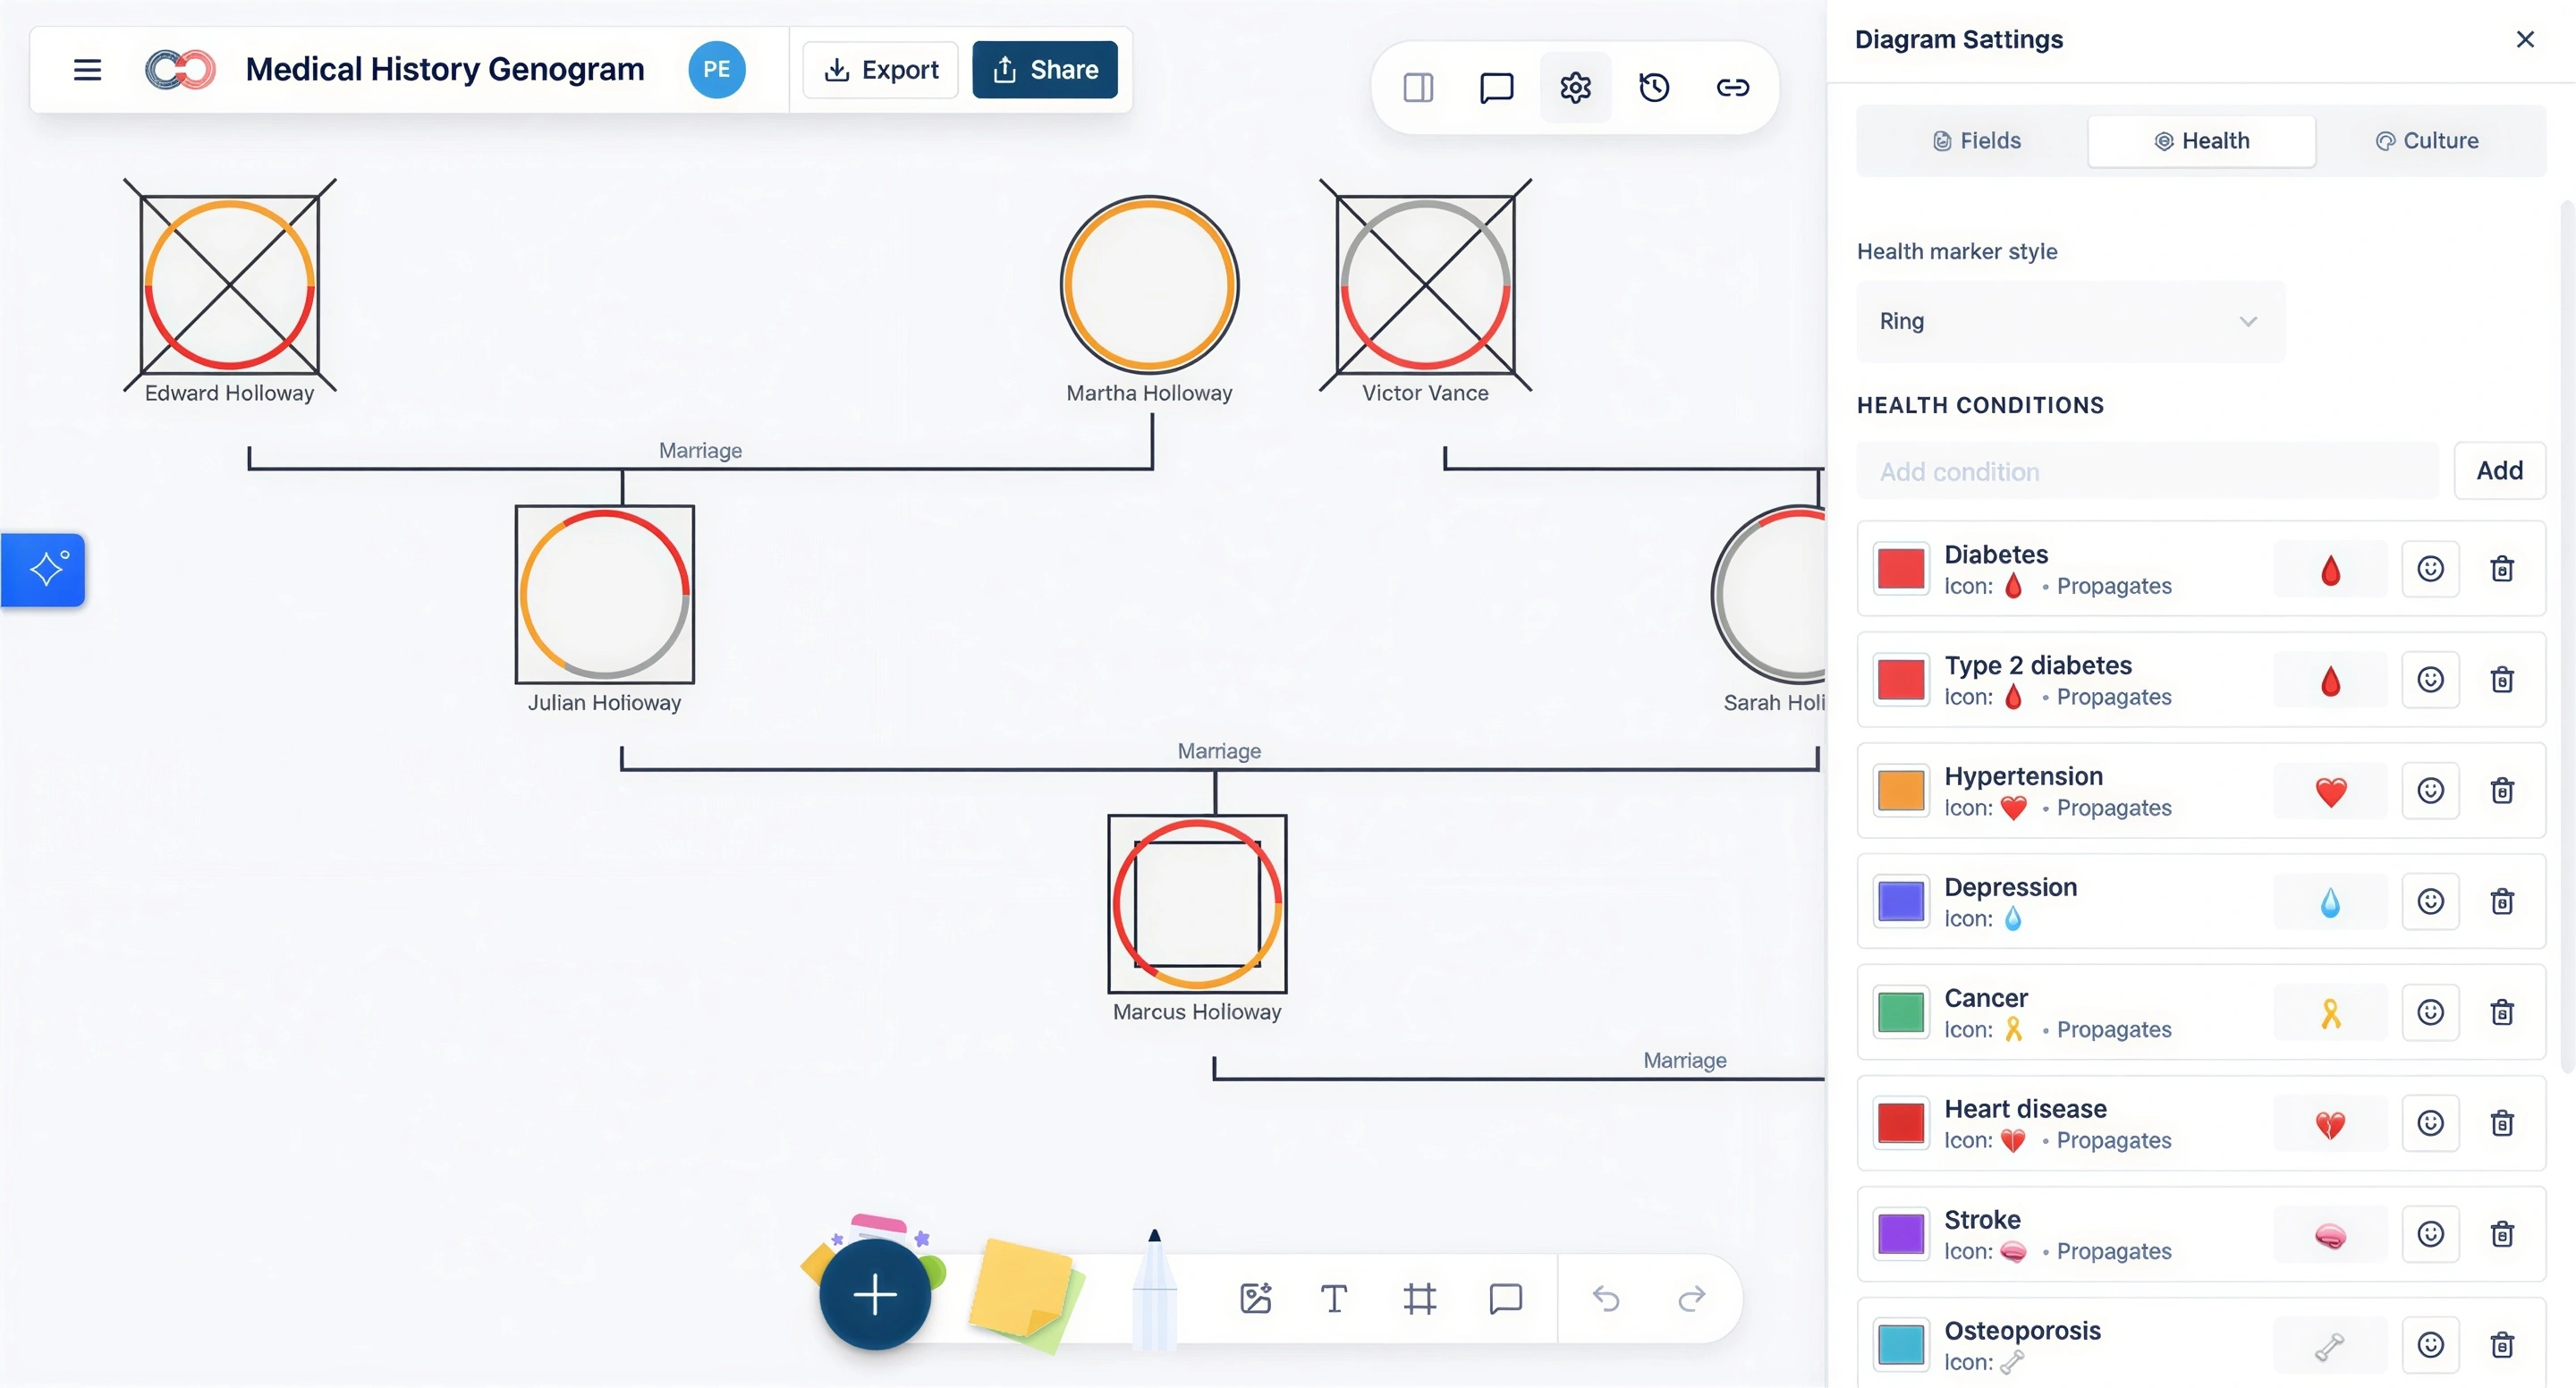
- Health View: This layer focuses on physical and mental well-being. It instantly highlights hereditary risks, chronic illnesses, causes of death, and patterns of substance abuse across three or more generations. By isolating these variables, you can more easily spot recurring medical trends that may be impacting the family’s current functioning.
Step 04. Professional Documentation
The final stage of the workflow moves beyond the diagram itself. Once your genogram is complete, you can use the report generation feature to turn it into a structured narrative. Creately also lets you export genogram data into text-based reports for different professional scenarios:
- Clinical Case File: A comprehensive, multi-section report designed for formal case reviews and clinical documentation.
- Health & Risk Summary: An overview highlighting hereditary family patterns and risk tables, accompanied by a diagram with health markers.
- Legal/Forensic Report: A structured document focusing on family environments, conflict-based ties, and a chronology of events suitable for court submission.
- Relationship Dynamics Summary: A deep dive into the “vibe” of the family, including a relationship matrix with tone labels and identified triangle patterns.
- Genealogical & Historical Report: A lineage-focused document capturing life events, education, and occupation patterns over generations.
- Session/Progress Snapshot: A concise therapy-oriented document highlighting changes since the last session and current interventions.
- Anonymized/Teaching Export: A privacy-first export that uses pseudonyms (e.g., P1, P2) and strips sensitive notes, perfect for training and academic research.
- Custom/Analytical Export: A versioned data document of individuals and relationships, optimized for research or integration with other clinical tools.
For a more in-depth lesson in making genograms, check our genogram tutorial and learn how to make one in minutes.
Social Work Genogram Examples
Let’s explore a few real-world case examples that highlight the effectiveness of genograms in social work practice.
School Setting
In a school setting, genograms help social workers understand a student’s family relationships and background. When a student struggles with school, genograms can show important issues like family conflicts or parents’ divorce. This helps social workers provide the right support based on the student’s family situation. Using genograms makes it easier to understand and help students succeed in their studies. Read our guide about different types of genograms, including family relationship genograms that may affect a student.
Work Setting
In a work setting, genograms help understand an employee’s stress, work-life balance, and support system. If someone is struggling at work or feeling burned out, a genogram can show problems at home, like caregiving duties or family stress. Knowing this helps create better support and solutions for the employee’s challenges. Using genograms helps improve employee well-being and work performance. Use this list of career genogram examples to learn more about issues that affect the workplace.
Relationship Counseling
In relationship counseling, genograms help understand the history and patterns between partners. When couples face ongoing conflicts, genograms reveal family communication styles and past issues that affect their relationship. This helps counselors identify problems and teach healthier ways to communicate. Using genograms supports couples in building stronger, happier relationships. You can find some useful examples of relationship-related conflicts with this counseling genogram template list.
Social Work Genogram Templates Made with Creately
The great thing about using Creately for making genograms in social work is the large template library that becomes available to you. Users can browse, select and customize these ready-made templates to make their job easier. Here are some more genogram templates to get started with.


Helpful Resources
Discover everything you need to know about genograms, from what they are, how to create a genogram, to how to understand what they mean.
Explore our collection of genogram templates.
Learn how different types of genograms can help visualize important aspects of life.
FAQs About Genograms in Social Work Practice
What are the ethical considerations that you should be aware of when creating genograms?
What is the difference between a genogram and a family tree?
How can you use Creately to create your social work genogram?
What are the different types of genograms in social work?
Resources
Butler, J.F. (2008). The Family Diagram and Genogram: Comparisons and Contrasts. The American Journal of Family Therapy, 36(3), pp.169–180. doi:https://doi.org/10.1080/01926180701291055.
Majhi, G., Reddy, S. and Muralidhar, D. (2018). The use of family genogram in psychiatric social work practice. Open Journal of Psychiatry & Allied Sciences, [online] 9(2), pp.98–102. doi:https://doi.org/10.5958/2394-2061.2018.00034.4.
Rempel, G.R., Neufeld, A. and Kushner, K.E. (2007). Interactive Use of Genograms and Ecomaps in Family Caregiving Research. Journal of Family Nursing, 13(4), pp.403–419. doi:https://doi.org/10.1177/1074840707307917.