Choosing the right network topology can feel like navigating a maze; one wrong decision, and you’re stuck with slow data flow, troubleshooting headaches, and scattered team workflows. That’s exactly why comparing Bus, Star, and Ring Topology upfront can save hours of frustration and keep your network running smoothly. In this guide, we’ll break down each topology, highlight the differences, and show you practical ways to visualize your network with ready-to-use templates.
What Are Network Topologies? A Quick Refresher
At its simplest, a network topology is the way devices are arranged and connected within a network. Think of it as the blueprint of your network—it defines how computers, servers, and other devices communicate, how data moves from one point to another, and how easy (or painful) the network is to manage when something goes wrong.
This network layout directly influences data flow in networks, performance, scalability, and troubleshooting. A well-designed topology makes connectivity feel effortless. A poorly planned one? That’s when teams start dealing with slow speeds, confusion, and endless “why isn’t this working?” moments.
Some of the most common types of network topologies include:
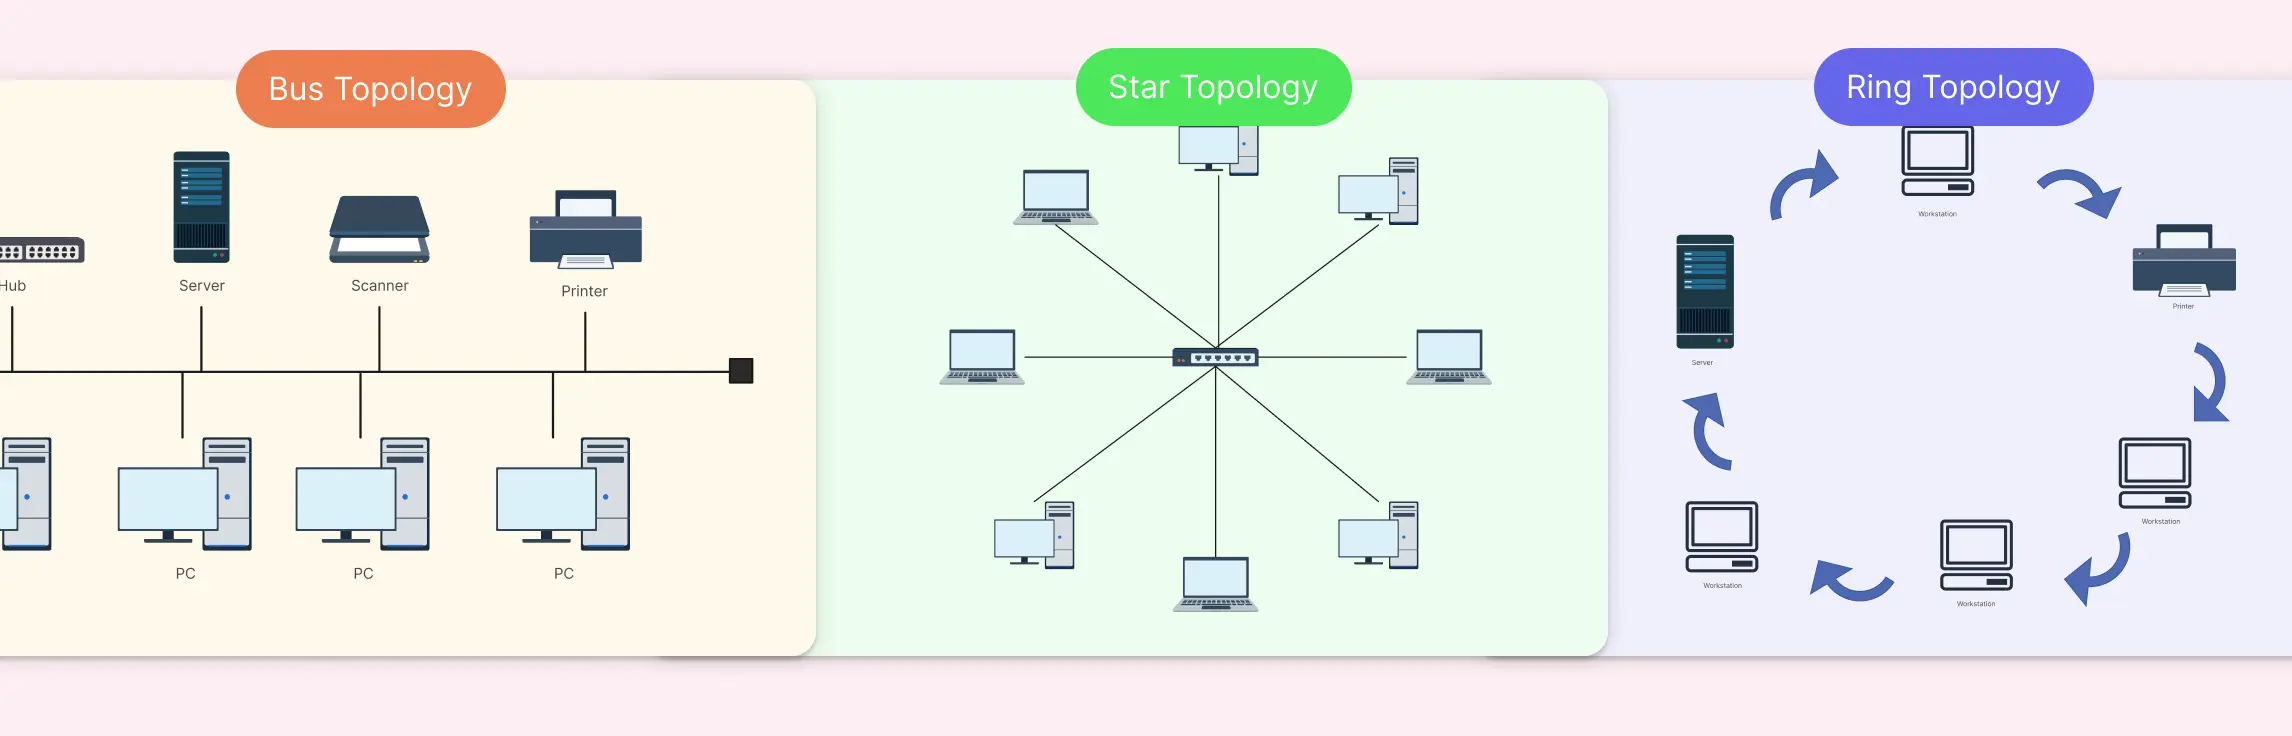
- Bus topology - where all devices share a single communication line
- Star topology - where devices connect through a central hub or switch
- Ring topology - where devices form a closed loop for data transmission
Each of these approaches represents a different connectivity design, with its own strengths, limitations, and ideal use cases.
Comparing Bus, Star, and Ring Network Diagram Types
Choosing between bus, star, and ring topology often comes down to trade-offs. Performance, cost, reliability, scalability, and security all behave very differently depending on the network layout you choose. Instead of forcing you to read between the lines, this side-by-side comparison brings the differences into sharp focus, so network engineers, IT teams, and planners can evaluate options quickly and confidently.
| Aspect | Bus Network Diagram | Star Network Diagram | Ring Network Diagram |
| Visual structure | Linear layout with a single backbone line and connected nodes | Hub-and-spoke layout centered around a switch or hub | Circular or looped layout with nodes connected in sequence |
| Ease of understanding | Simple for very small networks; quickly becomes cluttered | Very easy to read due to centralized layout | Moderate—flow is clear but requires directional understanding |
| Diagram clarity at scale | Low. Connections overlap as nodes increase | High. Clean structure, even with many nodes | Medium. Clarity drops as the ring grows |
| Data flow representation | Broadcast along the backbone | Point-to-point viaa central device | Sequential or token-based around the loop |
| Best use in documentation | Explaining legacy or temporary setups | Standard for modern office and enterprise networks | Showing controlled or deterministic data flow |
| Troubleshooting visualization | Harder. The fault source isn’t obvious visually | Easy. Problem areas are quickly isolated | Moderate. Breaks are visible, but the impact is broader |
| Scalability in diagrams | Poor. Diagram complexity increases rapidly | Excellent. Easy to extend with additional nodes or switches | Moderate.Manageable with structured layouts |
| Security visualization | Limited. Segmentation is not obvious | Strong. Access control points are clear | Moderate. Security zones can be shown with annotations |
| Template flexibility | Low. A few variations once the backbone is defined | High. Supports hierarchical and multi-tier diagrams | Medium. Often requires precise alignment |
| Ideal diagram audience | Students or teams explaining basic concepts | IT teams, stakeholders, and decision-makers | Technical teams needing precise flow understanding |
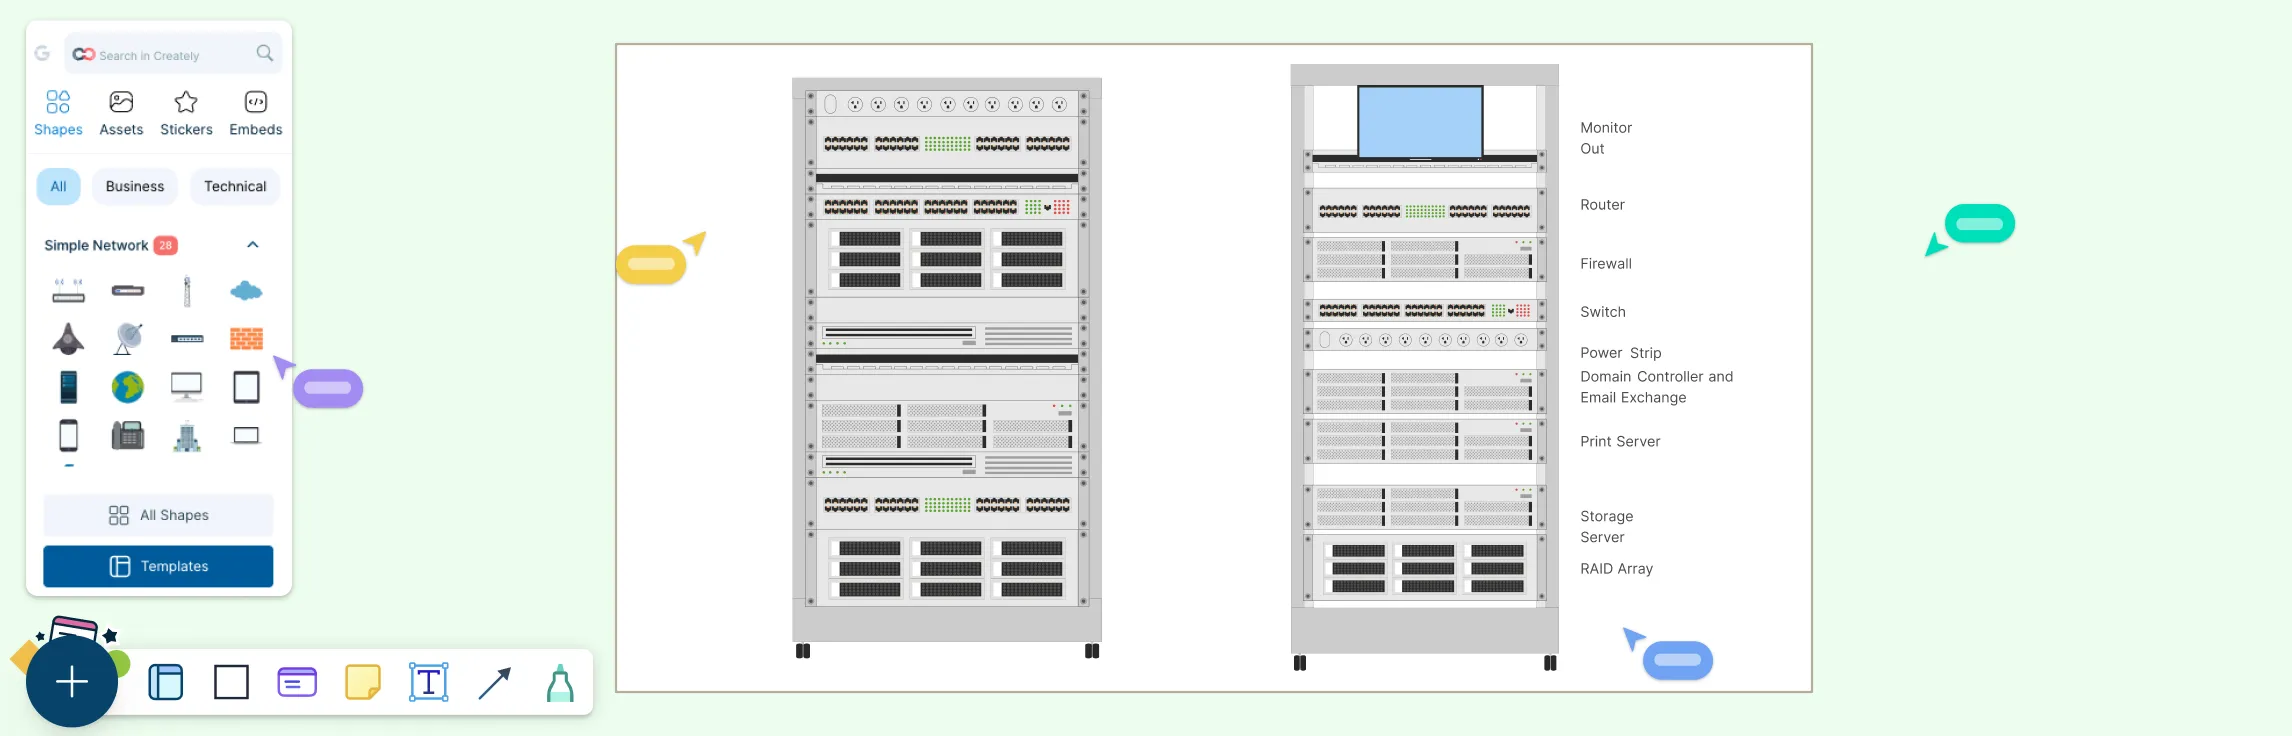
Ready-to-Use Network Topology Templates
Designing a network doesn’t have to be a headache. With visual templates, you can map out your network structure in minutes instead of hours. Templates eliminate guesswork, reduce miscommunication, and give teams a shared view of your network from day one. Whether you’re planning a small office network or a complex enterprise setup, these templates help you start fast, stay organized, and expand with confidence.
Bus Topology Templates
- Visual Layout: Linear backbone with connected nodes.
- Best for: Small networks, temporary setups, or educational purposes.
- Why it helps: Clearly shows shared communication paths, making it easy to identify bottlenecks or collisions.


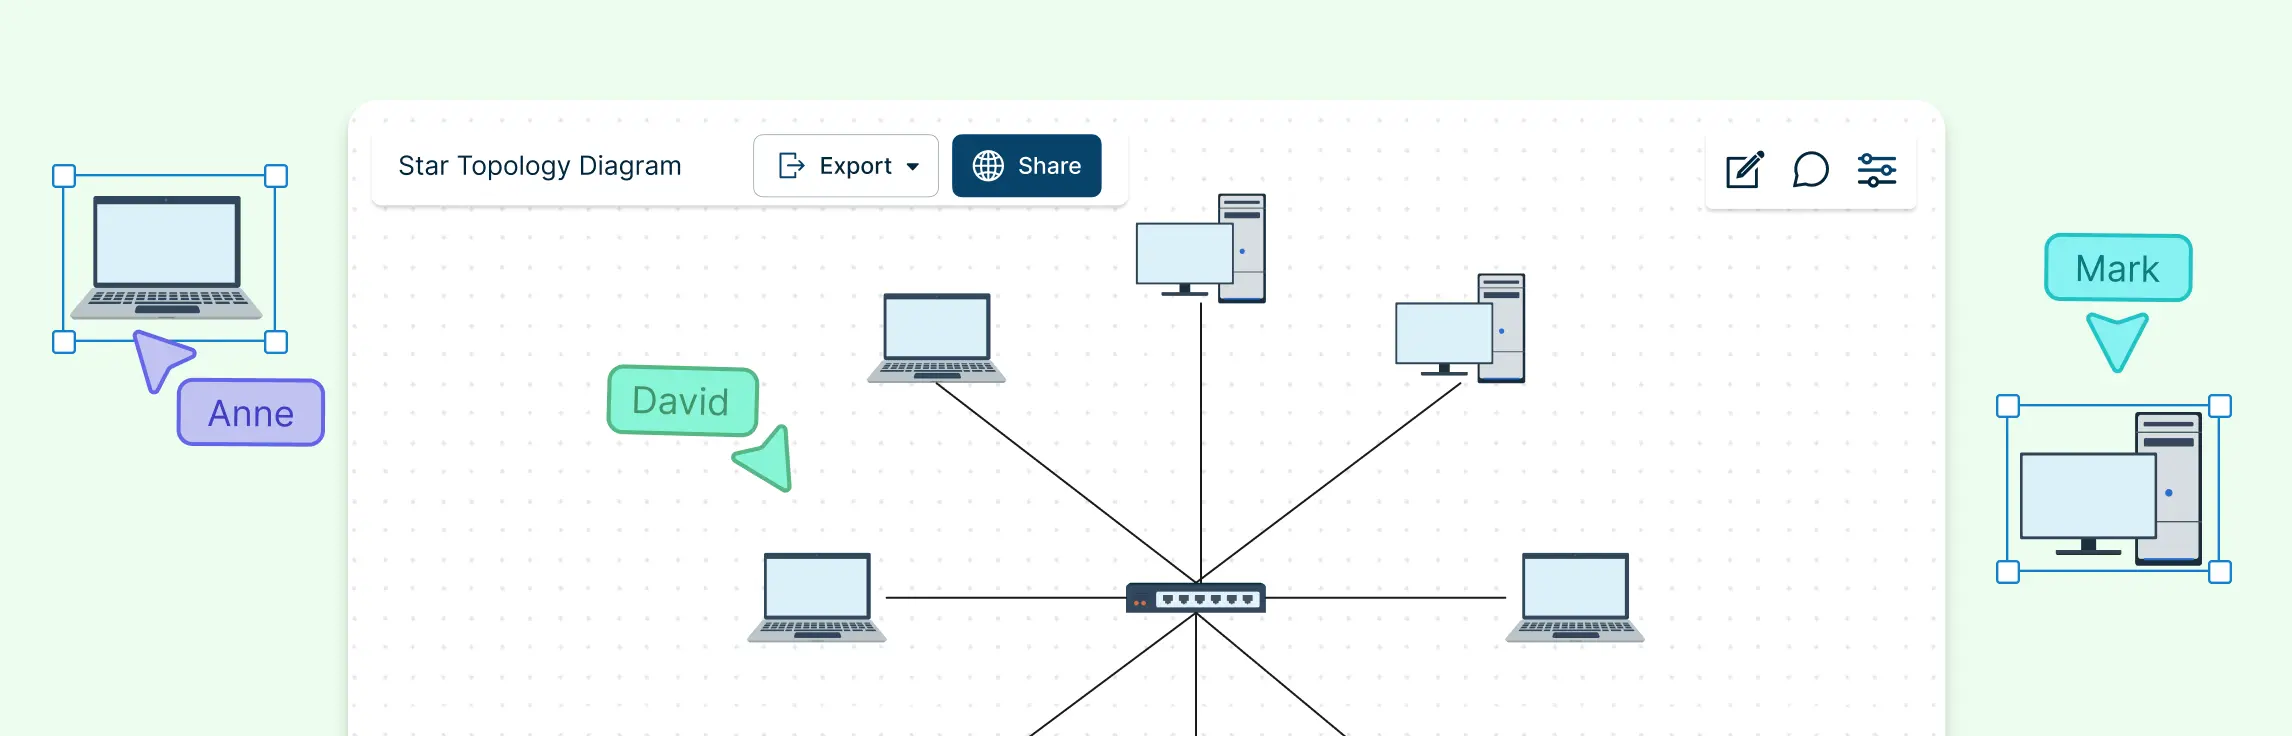
Star Topology Templates
- Visual Layout: Central hub with spokes extending to each device.
- Best for: Modern offices, cloud-connected networks, or scalable enterprise environments.
- Why it helps: Highlights the central switch, simplifies monitoring, and shows redundancy paths for reliability.


Ring Topology Templates
- Visual Layout: Circular loop connecting each node sequentially.
- Best for: Networks requiring controlled or deterministic data flow, like legacy systems or token-based setups.
- Why it helps: Makes data flow clear and identifies points of potential failure in the loop.


Best Practices for Network Topology Planning
Smart network planning isn’t just about choosing between bus, star, or ring topology, it’s about designing a network that stays clear, flexible, and easy to manage as your team and infrastructure grow. The best networks are planned with both today’s needs and tomorrow’s changes in mind.
Here are proven best practices to help you design, expand, and maintain networks efficiently, without adding unnecessary complexity.
Start with clarity, not cables
Before adding devices or connections, map out how data needs to flow across your network. Visualizing the topology early helps uncover bottlenecks, unnecessary hops, or single points of failure before they turn into real problems. A clear diagram becomes a shared reference point for everyone involved.
Design for scalability from day one
Even small networks grow faster than expected. Choose a topology that supports easy expansion, and leave room in your design for additional nodes, switches, or redundancy. Visually documenting growth paths makes future upgrades faster and far less disruptive.
Reduce risk with visualized redundancy
Single points of failure are easier to miss in text-based documentation. Network diagrams make them obvious. By visually planning redundancy, such as backup links, secondary switches, or failover paths, you can improve reliability while keeping the design understandable.
Keep documentation aligned with reality
Outdated network documentation creates confusion and slows down troubleshooting. Maintaining live, editable diagrams ensures your documentation evolves with the network. This dramatically reduces miscommunication between IT teams, stakeholders, and external partners.
Use visual workflows to improve collaboration
When network designs live only in one person’s head or scattered files, collaboration breaks down. A shared visual workflow brings everyone onto the same page: engineers, managers, and decision-makers alike. Diagrams make complex connectivity designs easier to discuss, review, and improve together.
Plan for security and management visibility
Good topology planning makes it easy to see where access controls, monitoring points, and segmentation should exist. Visual diagrams highlight security boundaries clearly, helping teams manage risk without overcomplicating the design.
At the end of the day, effective network planning is about reducing friction. Clear, visual diagrams eliminate scattered workflows, prevent misunderstandings, and support better team collaboration, turning network design into a process that feels structured, aligned, and surprisingly efficient.
The fastest way to turn these insights into action is with Creately. Its intuitive network diagram templates let you visualize, collaborate, and scale your network effortlessly, so your team can stop guessing and start building networks that just work.
Helpful Resources
Learn how to draw a network diagram step by step, from planning what to include to laying out components clearly and choosing the right symbols.
Discover key bus topology diagram elements, highlight common design patterns, and point out the limitations you need to account for when working with this topology.
Understand how to approach Cisco network topology diagrams with confidence and create visuals that are practical, accurate, and easy to understand.
Learn how to create a home network setup diagram step by step, understand common layouts, follow practical best practices, and use free templates to map your setup.
Discover how to create a wide area network diagram step by step, understand key components, WAN examples, and follow proven best practices.
Explore what hybrid topology diagrams are, the hybrid types & examples, highlight advantages and disadvantages, provide a step-by-step creation process, and best practices.
Everything you need to know about LANs, from the basics and key components to network types, advantages, and best practices.
Visual diagrams make these checks much faster because the flow of data is clearly mapped.FAQs About Bus vs Star vs Ring Topologies
Which topology is best for small networks?
Can I mix topologies in one network?
How do I quickly identify network issues in each topology?
What’s the easiest way to keep diagrams updated?
How do I show security and access controls in network diagrams?
How do I make troubleshooting faster with diagrams?